
Figure 3. Expression pattern of selected RTKs in melanoma subtypes.
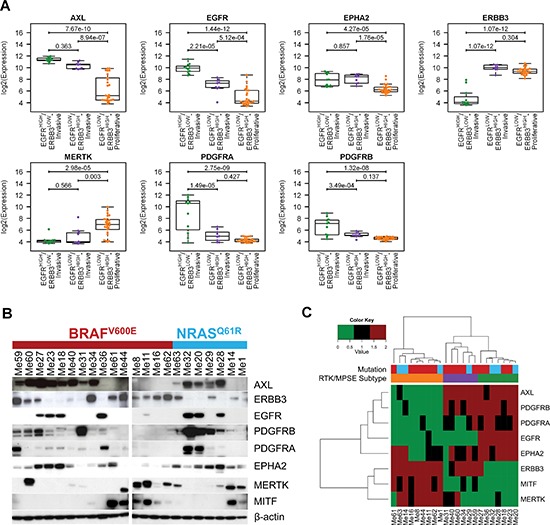
(A) Box-plot showing the distribution of log2 expression values of RTKs with the most significant differential expression according to melanoma subtypes in CCLE dataset. Statistical analysis by ANOVA followed by Tukey's post-hoc test. (B) Western blot analysis of the seven most relevant RTKs and MITF in the panel of 22 melanoma cell lines. The BRAF and NRAS mutational status is reported. Since preliminary results indicated that levels of RTKs were not affected by culture conditions such as serum-free or serum-containing medium, all analyses were performed by cells grown under standard culture conditions. (C) Heatmap representing the hierarchical clustering of protein expression investigated in panel (B) for 22 melanoma cell lines. The RTK/MPSE subtype and mutational status are reported and are colored as in (A) and (B) respectively.