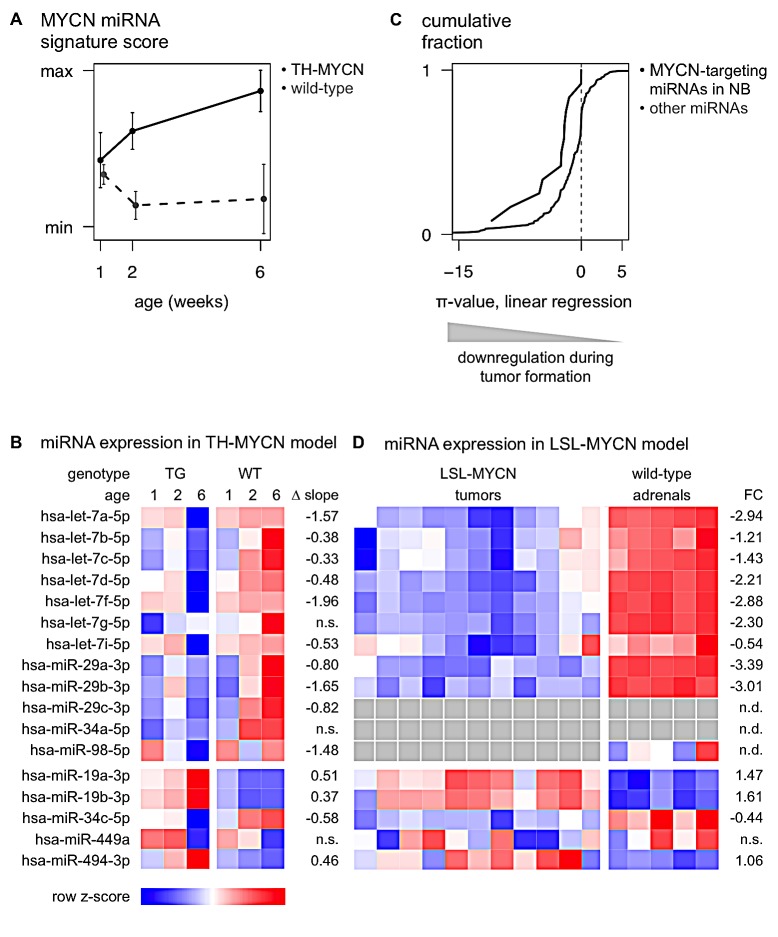
Figure 4. miRNAs that regulate MYCN are downregulated during murine MYCN-driven neuroblastoma tumor formation.
(A) The MYCN miRNA signature score, representing expression of known MYC(N)-regulated miRNAs, increases during neuroblastoma progression in ganglia from TH-MYCN mice (TG, black) compared to ganglia from wild-type mice (WT, gray dashed). Data are presented as mean ± standard deviation of four samples. (B) Heatmap of average miRNA expression levels during murine MYCN-driven neuroblastoma development. Data are presented as row normalized. TG: transgenic; WT: wild-type; Δ slope: the difference in regression slope between TG and WT samples; n.s.: non-significant difference (Benjamini & Hochberg multiple testing corrected p-value > 0.05). (C) The 12 MYCN-targeting miRNAs in neuroblastoma show significantly more downregulation during MYCN-driven tumor development, compared to non-targeting miRNAs. Kolmogorov-Smirnov test, p-value = 9.2 × 10⁻³. (D) Heatmap of miRNA expression levels in 11 LSL-MYCN;Dbh-iCre tumors and 5 normal adrenals. For miR-29c-3p and -34a-5p, no expression data was available; miR-98-5p was not expressed in LSL-MYCN;Dbh-iCre tumors. Data are presented as row normalized. gray: no data available. FC: log2 fold change; n.d.: no data available; n.s.: non-significant fold change (Student T-test, Benjamini & Hochberg multiple testing corrected p-value > 0.05).

