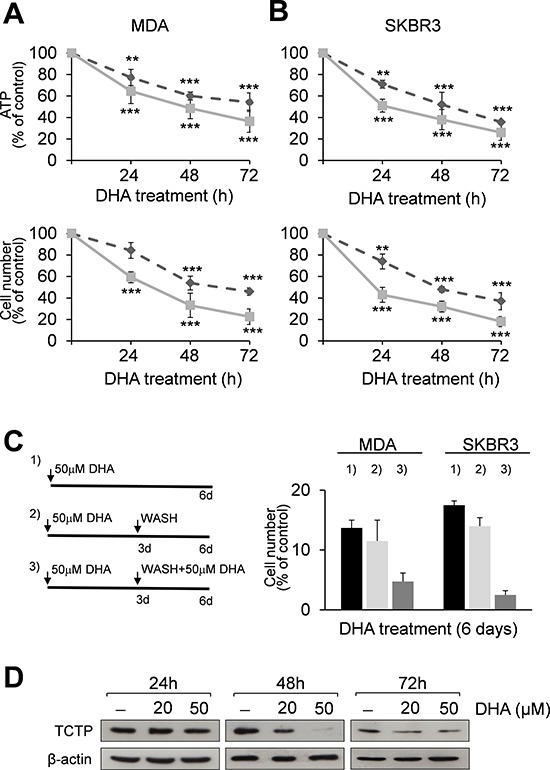
Figure 1. DHA reduces cell viability and TCTP expression levels in MDA and SKBR3 cells.

MDA (A) and SKBR3 cells (B) were treated with 20 (----) and 50 μM (–) DHA for 24, 48 and 72 h. At the end of incubation time, the number of viable cells was determined using ATP-assay (upper panels) and trypan blue dye exclusion assay (lower panels). Data are expressed as the percentage of viable cells relative to controls. Values represent the mean ± SD, n = 3. Significant differences between treated and control cells, at any time of treatment, are indicated, ** = p < 0.01, *** = p < 0.001. (C) Exponentially growing MDA and SKBR3 cells were cultured for 6 days and treated with 50 μM DHA (panel C, left): 1) cells were exposed to DHA for 6 days; 2) cells were exposed to DHA for 3 days and then the drug was removed; 3) on day 3 cells were washed with fresh media and treated again with 50 μM DHA for 3 days. Data are expressed as the percentage of viable cells relative to controls. Values represent the mean ± SD, n = 3. (D) Western Blot analysis of TCTP in cell lysates of MDA cells after 24, 48 and 72 h of exposition to DHA. β-actin was used as loading control.
