
Figure 3. Analysis of cell growth in PATZ1-transfected thyroid cancer cells.
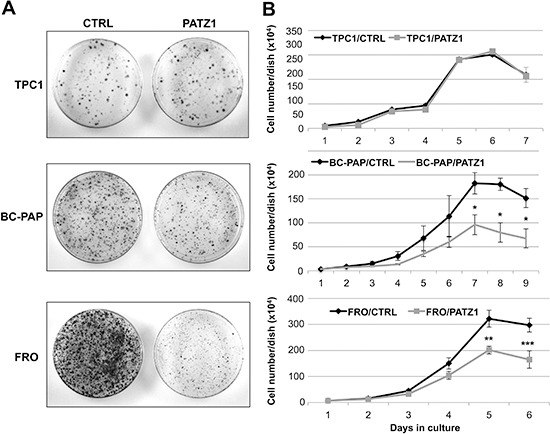
(A) Colony-forming assays in human thyroid cancer cell lines transfected with PATZ1. TPC-1, BC-PAP and FRO cells were transfected with a vector expressing PATZ1 cDNA or its corresponding empty vector. Cells were cultured for 10 days, selected for resistance to G418, and stained with crystal violet. (B) Growth curves on different stably expressing PATZ1 cell clones and/or mass populations of TPC1, BC-PAP and FRO cells compared to controls expressing the empty vector. Mean values ± SE of at least three clones for each cell line are reported: For TPC1, clone C-1, parental TPC1 and mock-transfected mass population were used as control, whereas clones PA1, PA5 and PA6 were used as PATZ1-transfected cells; for FRO, clones C-4, C-7 and parental FRO were used as control, whereas clones PA11, PA13 and PA17 were used as PATZ1-transfected cells; for BC-PAP, clone C-1, parental BC-PAP and mock-transfected mass population (mp C-) were used as control, whereas PA2, PA3, PA7, PA10 and PATZ1-transfected mass population (mp PA) were used as PATZ1-transfected cells. PATZ1 expression in each clone or mass population is shown in supplementary Figure S1. *, P < 0.05; **, P < 0.01; ***, P < 0.001.