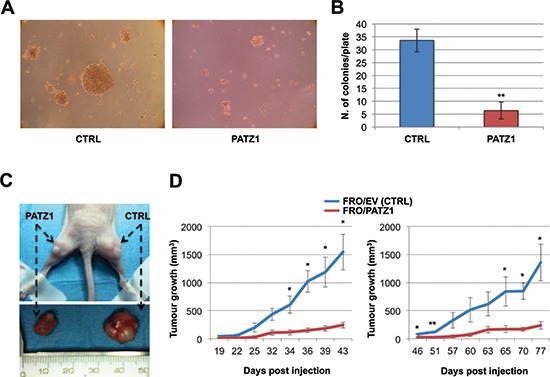
Figure 5. PATZ1 inhibits in vitro and in vivo tumorigenicity in FRO cells.

(A) Representative images of growth in soft agar of control (CTRL) and PATZ1-expressing FRO cells. (B) Colonies larger than background (as observed in normal control cells) were counted after 2 weeks. Mean values ± SE of two controls (C-4 and parental FRO) and three PATZ1-expressing clones (PA13, PA16, PA17) are reported. PATZ1 expression in each clone is shown in supplementary Figure S1. **, P < 0.01. (C) Representative nude mouse (upper panel) injected with FRO/PATZ1 cells (clone PA13) at the left side and FRO/EV (CTRL) cells (clone C-4) at the right side. Tumors (lower panel) were excised when one of the two contralateral tumors reached the cut-off of 1500 mm3. (D) Tumor growth curves in cohorts of 3 mice (left panel) and 4 mice (right panel). Mean values ± SE are reported. *, P < 0.05; ** P < 0.01. FRO/EV = empty vector-transfected FRO cells.
