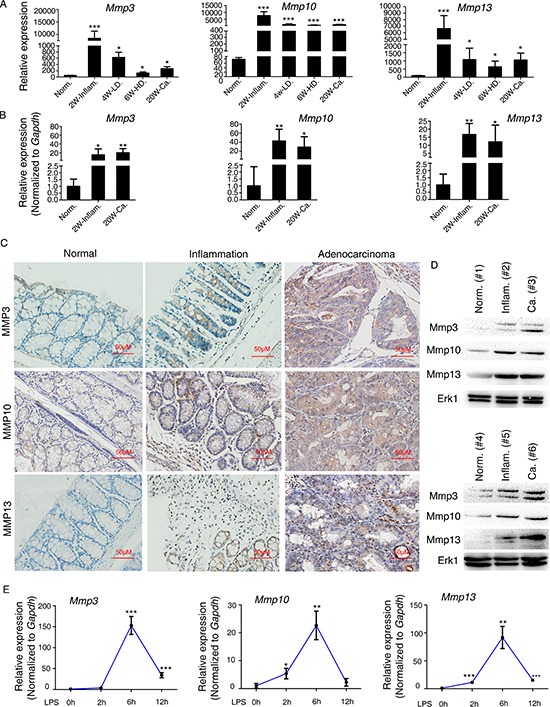
Figure 1. Mmp3, Mmp10, and Mmp13 are upregulated during CAC progression in mice.

(A) Recapitulated are the mRNA expression patterns of Mmp3, Mmp10, and Mmp13 based on our previous microarray analysis (GSE31106[; ref. 7]) of the AOM/DSS-induced CAC mouse model. Abbreviations: Norm, normal; Inflam, inflammation; LD, low-grade dysplasia; HD, high-grade dysplasia; Ca, adenocarcinoma. (B) qRT-PCR analysis of the mRNA levels of Mmp3, Mmp10, and Mmp13 in mouse colitis tissue, CAC tissue, and normal colon tissue. Relative expression of Mmp3, Mmp10, and Mmp13 was determined by using the 2−ΔΔCt method. (C) Representative expression patterns of Mmp3, Mmp10, and Mmp13 (determined by immunohistochemistry) in mouse colitis tissue, CAC tissue, and normal colon tissue. (D) Representative expression patterns of Mmp3, Mmp10, and Mmp13 (determined by western blot) in mouse normal colon tissue (Norm.) colitis tissue (Inflam.) and CAC tissue (Ca.). (E) Kinetics of LPS-induced Mmp3, Mmp10, and Mmp13 expression in RAW264.7 murine macrophages. RAW264.7 cells were stimulated with LPS (100 ng/ml) for 0, 2, 6, or 12 h. Mmp3, Mmp10, and Mmp13 mRNAs were quantified by qRT-PCR. All data are shown as the mean ± SD. *p < 0.05, **p < 0.01, ***p < 0.001 compared with control.
