
Fig. 6. Antitumor activity of humanized 2173 CART-EGFRvIII cells in vivo.
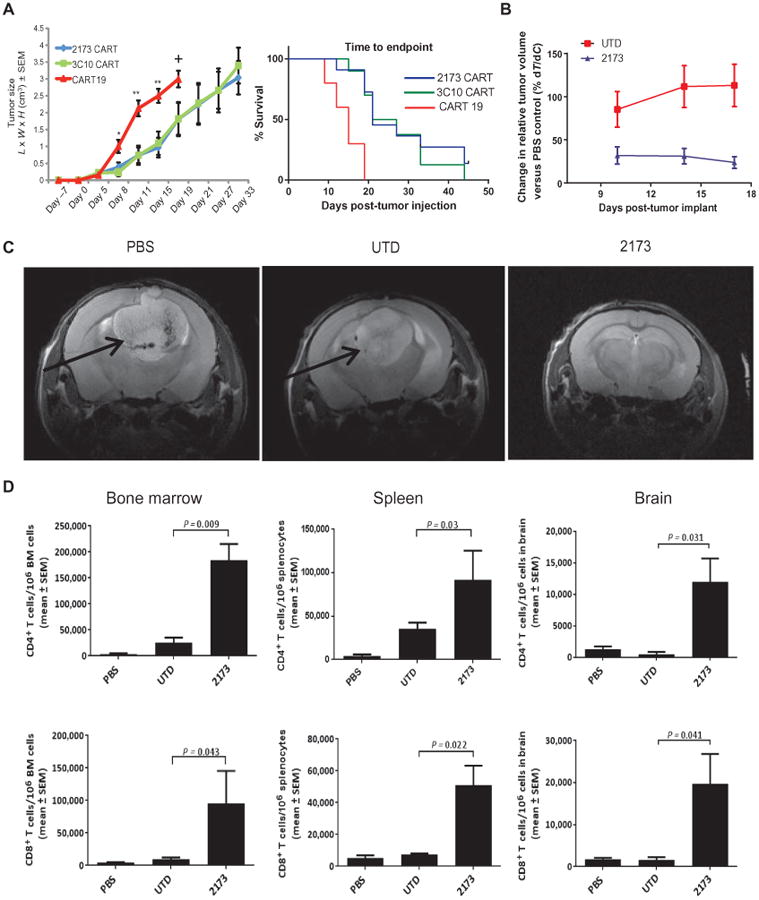
(A) NSG mice injected with U87-EGFRvIII tumors subcutaneously on day 0 and with T cells as indicated intravenously on day 7. Left plot indicates mean ± SEM of calculated tumor volume based on caliper measurements over time. Statistically significant differences between EGFRvIII CARs and CD19 CARs are marked by asterisks [*P = 0.01, **P = 0.003; n = 10 mice per group; one-way analysis of variance (ANOVA), Kruskal-Wallis test]. + indicates euthanasia. Survival based on time to endpoint was plotted using a Kaplan-Meier curve (Prism software); statistically significant differences between the experimental groups were determined using log-rank Mantel-Cox test (P = 0.0002). Endpoint was defined by tumor reaching 2 cm in any direction or a volume of 4 cm3, ulceration, more than 10% weight loss, or inability to ambulate. (B) Effect of 2173 CART-EGFRvIII cells and UTD T cells compared to PBS on intra cranial tumor volume over time. Mice were injected intracranially with 5 × 10⁴ U87-EGFRvIII cells on day 0; on day 7, mice were injected intravenously with 4 × 10⁶ CAR T cells or a matched number of total UTD T cells or PBS. Plots show means ± SEM of the calculated %T/ΔC for the days indicated. The study was terminated, and all mice were euthanized on day 18 due to the disease burden and condition of the mice in the PBS and UTD groups. n = 10 mice per group. (C) Magnetic resonance imaging (MRI) of intracranial U87-EGFRvIII tumors in mice 11 days after CAR T cell injection (day 18 of study). Arrows indicate tumor mass. n = 2 mice per group imaged with one representative image shown. (D) Numbers of CD4+ and CD8+ T cells in bone marrow (BM), spleen, and brain of intracranial tumor-bearing mice on day 18. Tissues were harvested, processed into a single-cell suspension, and stained with antibodies for enumeration of T cells by flow cytometry. Plots indicate means ± SEM number of T cells per million cells as measured by flow cytometry of each homogenized organ. Statistically significant differences were calculated by one-way ANOVA, using Dunnett's test (n = 8 mice per group; P values as indicated).