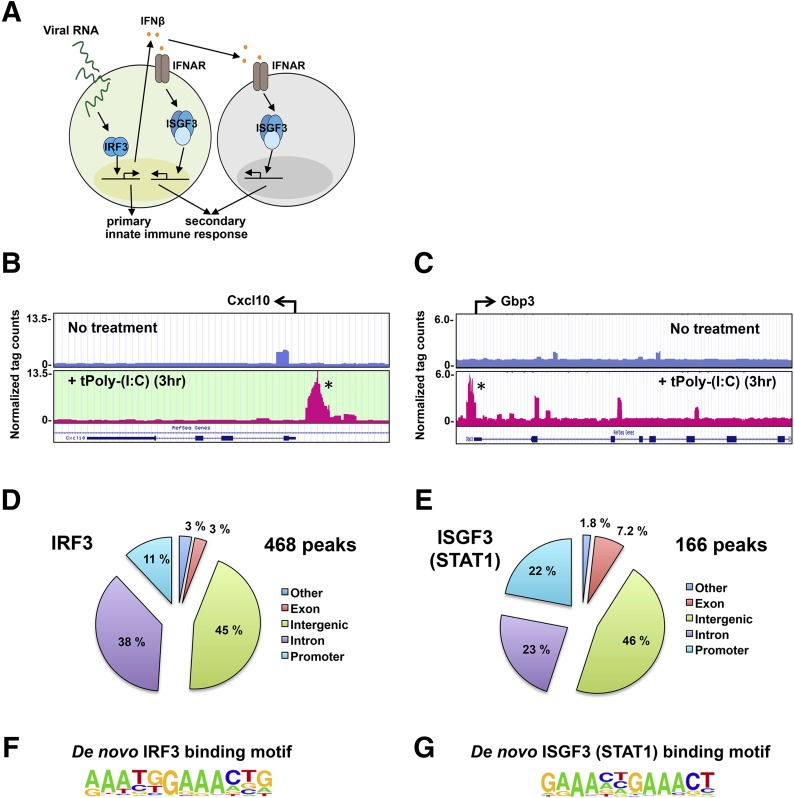
Figure 1. ChIP-seq analysis of IRF3 and ISGF3.
(A) Schematic diagram of primary and secondary innate-immune responses to viral RNA stimulation. (B, D, and F) IRF3 ChIP-seq analysis of murine BMDMs transfected with dsRNA (5 µg/ml) for 3 hours. (C, E, and G) ISGF3 (STAT1) ChIP-seq analysis of BMDMs transfected with dsRNA (5 µg/ml) for 3 hours. (B and C) Example genome browser tracks of unstimulated BMDMs (upper) and BMDMs transfected with dsRNA (5 µg/ml) for 3 hours (lower) for Cxcl10 and Gbp3 example genes, respectively. tPoly-(I:C), transfected poly (I:C). (D and E) Location analysis of IRF3 (D)- and ISGF3 (E)-binding sites (peaks). IRF3- and ISGF3-binding peaks were mapped relative to their nearest RefSeq genes. The promoter region was defined as <1 kb upstream from the TSS. (F and G) Consensus motif position weight matricies generated by a de novo motif search of IRF3- and ISGF3-binding sites. Motifs were analyzed within ±50 bp from the center of a given peak.

