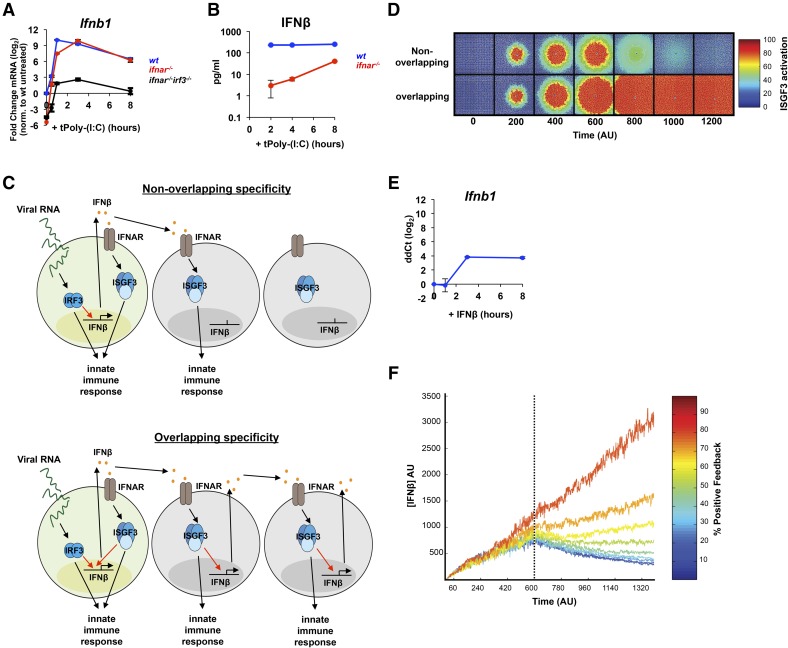
Figure 4. IRF3 specificity in the expression of IFN-β prevents an IFN storm.
(A) qRT-PCR) analysis of ifnb mRNA expression in WT (blue), ifnar−/− (red), and ifnar−/− irf3−/− (black) BMDMs transfected with dsRNA (5 µg/ml). All data points are normalized to unstimulated WT mRNA levels and reported as fold change on a log2 scale. Error bars represent PCR triplicates. Data are representative of 3 experiments that gave consistent results. (B) ELISA analysis of secreted IFN-β in the media following dsRNA transfection (5 µg/ml) of WT BMDMs. Error bars represent triplicate wells, and the results shown are representative of 2 experiments. (C) Two models to illustrate the following scenarios. (Upper) A scenario in which IRF3 and ISGF3 have nonoverlapping specificities, and only IRF3 can activate IFN-β expression. (Lower) A scenario in which IRF3 and ISGF3 can activate IFN-β expression to the same degree. (D) Model simulation of ISGF3 activation across a 2-dimensional layer of cells by use of mathematical models representing the scenarios depicted in C. (E) qRT-PCR analysis of IFN-β mRNA expression in WT BMDMs following treatment with IFN-β (100 units/ml). ddCt, ΔΔ Cycle threshold. (F) Model simulation of total IFN-β concentration over time with feedback strength from 10 to 90%.

