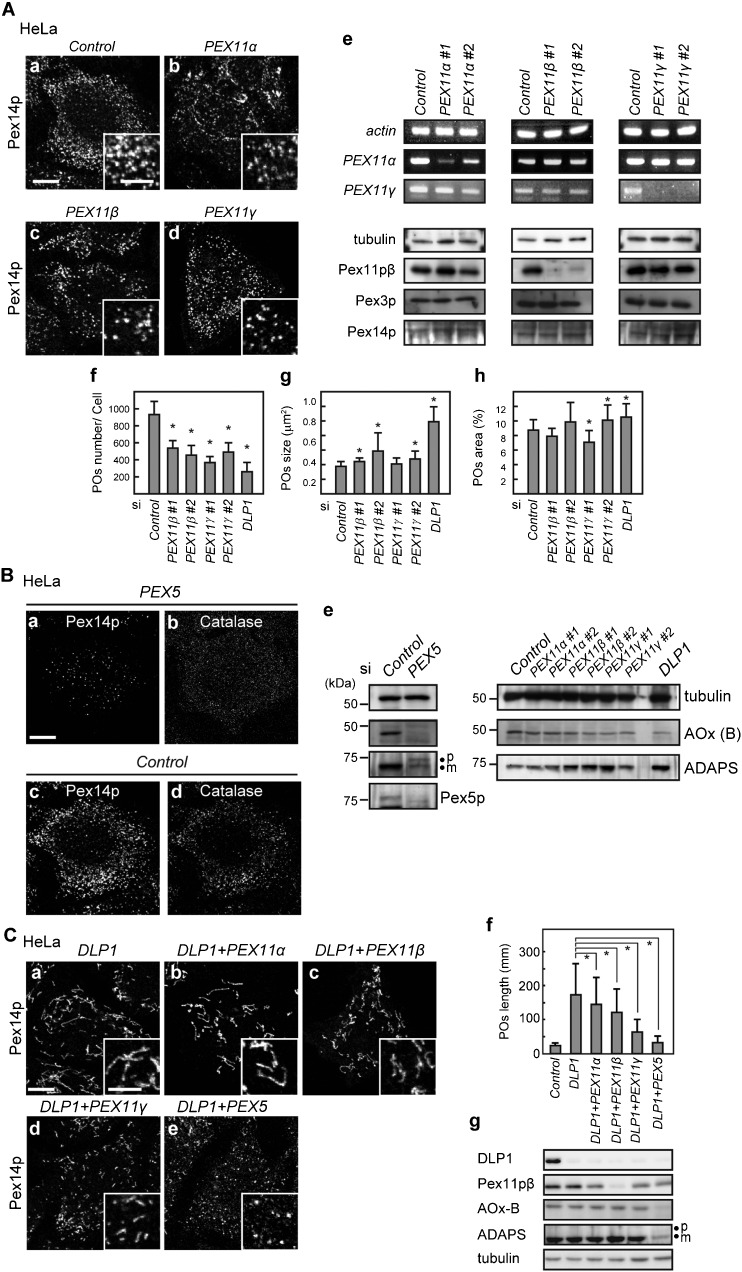
Fig. 7. Knockdown of PEX11 in HeLa cells.
(A) HeLa cells were treated for 96 h with a control siRNA (a) or siRNA for PEX11α (b), PEX11β (c), or PEX11γ (d). Cells were then immunostained with an anti-Pex14p antibody. Scale bars: 10 µm and 5 µm (inset). The efficiency of knockdown was evaluated by RT-PCR (e, upper panel) and western blotting (e, lower panel). PEX11α and PEX11γ mRNA levels were assessed by RT-PCR using total RNA. Actin was used as a loading control. Pex11pβ protein levels were verified by immunoblot analysis using the antibody to Pex11pβ. Peroxisomal marker proteins, Pex3p and Pex14p, were also assessed. Tubulin was used as a loading control. Peroxisomal abundance per cell (f), average peroxisomal size (g), and peroxisomal area per cell (h) in each siRNA-treated cell type were determined as described in the Materials and Methods. At least 20 cells were randomly selected and analyzed at each time point. Data represent the means±SD. *p<0.05. (B) HeLa cells were treated with a control siRNA or siRNA for PEX5 for 48 h and immunostained with antibodies to Pex14p (a,c) and catalase (b,d). Scale bar: 10 µm. Cells were lysed and analyzed by SDS-PAGE and immunoblotting using the antibodies indicated on the right in the panel (e). ‘p’ and ‘m’ in the panel of ADAPS indicates the larger ADAPS precursor harboring PTS2 and its mature form, respectively. (C) HeLa cells were transfected for 96 h with siRNAs each for DLP1 (a) in combination with the indicated genes (b–e). Cells were then subjected to immunostaining with an anti-Pex14p antibody. Scale bars: 10 µm and 5 µm (inset). The average lengths of peroxisomes of the cells were measured and plotted in (f). Cells were lysed and analyzed by SDS-PAGE and immunoblotting using the antibodies indicated on the left in the panel (g). Data represent the means±SD. *p<0.05.

