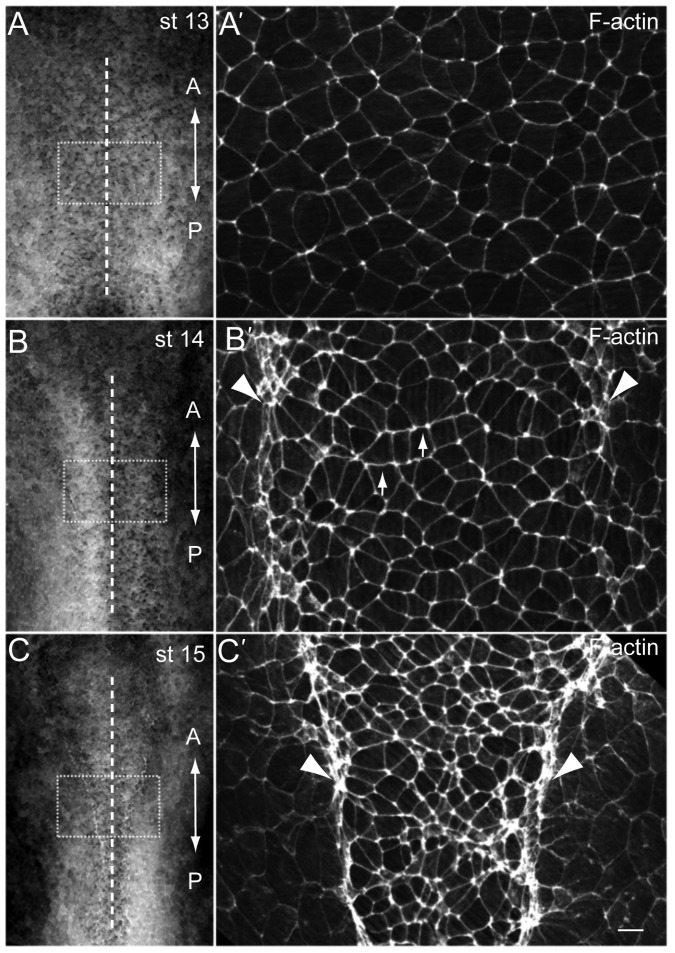
Fig. 1. Polarized F-actin cables in the Xenopus neural plate.
F-actin was visualized by phalloidin staining in the Xenopus neural plate at the beginning of neurulation. Representative explants are shown at stage 13 (st. 13, A), st. 14 (B) and st.15 (C). Boxed regions are magnified in A′–C′. Apical constriction of neural plate cells is first evident along the dorsolateral hinge regions (arrowheads), and later throughout the neural plate. F-actin cables become more pronounced in the mediolateral rather than anteroposterior orientation, forming stripes along anteroposterior cell faces (arrows). The anteroposterior (‘A–P’) axis of the neural plate is indicated. Dashed line, the neural plate midline. Scale bar, 20 µm.

