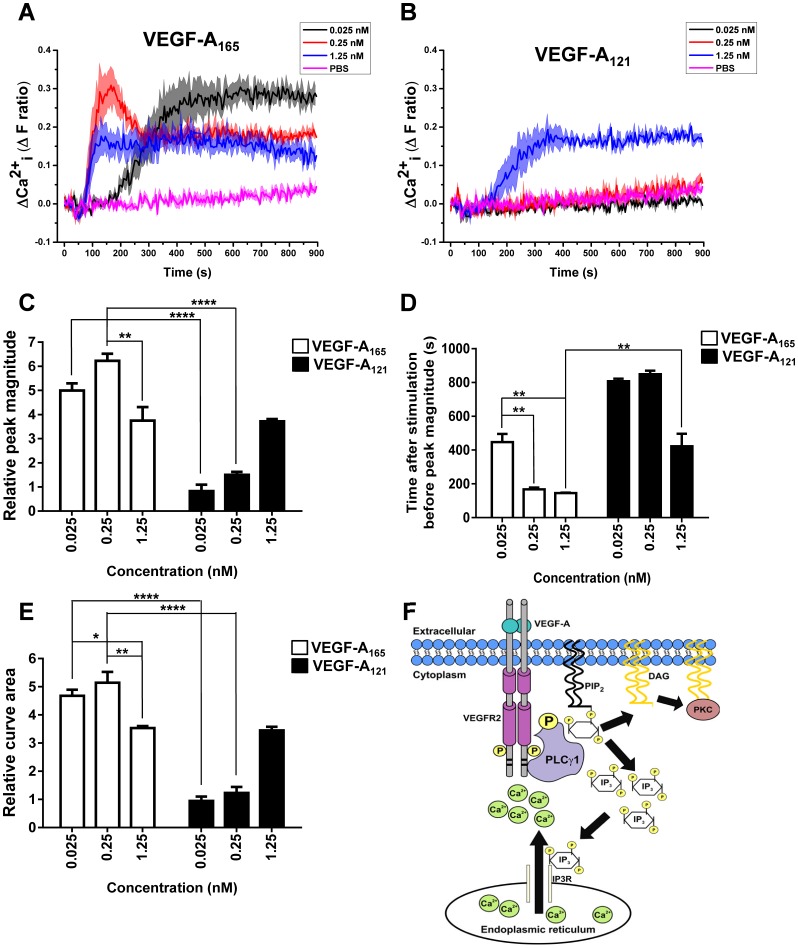
Fig. 3. VEGF-A isoform-specific release of intracellular Ca2+.
(A,B) Real-time monitoring of cytosolic Ca2+ flux with (A) VEGF-A165 or (B) VEGF-A121 titration; graphs show a representative plot of multiple experiments. Error bars indicate ±SEM (n = 1, N = 4). (C–E) Quantification of (C) peak magnitude, (D) time taken to reach peak magnitude or (E) the total curve area upon stimulation with VEGF-A165 and VEGF-A121. Error bars indicate ±SEM (n = 3). (F) Schematic depicting VEGF-A-stimulated second messenger targeting of InsP3 receptors (InsP3R) and subsequent cytosolic calcium ion rise. PtdIns(4,5)P2 hydrolysis to generate diacylglycerol (DAG) and Ins(1,4,5)P3 is depicted. p<0.05 (*), p<0.01 (**), p<0.0001 (****).

