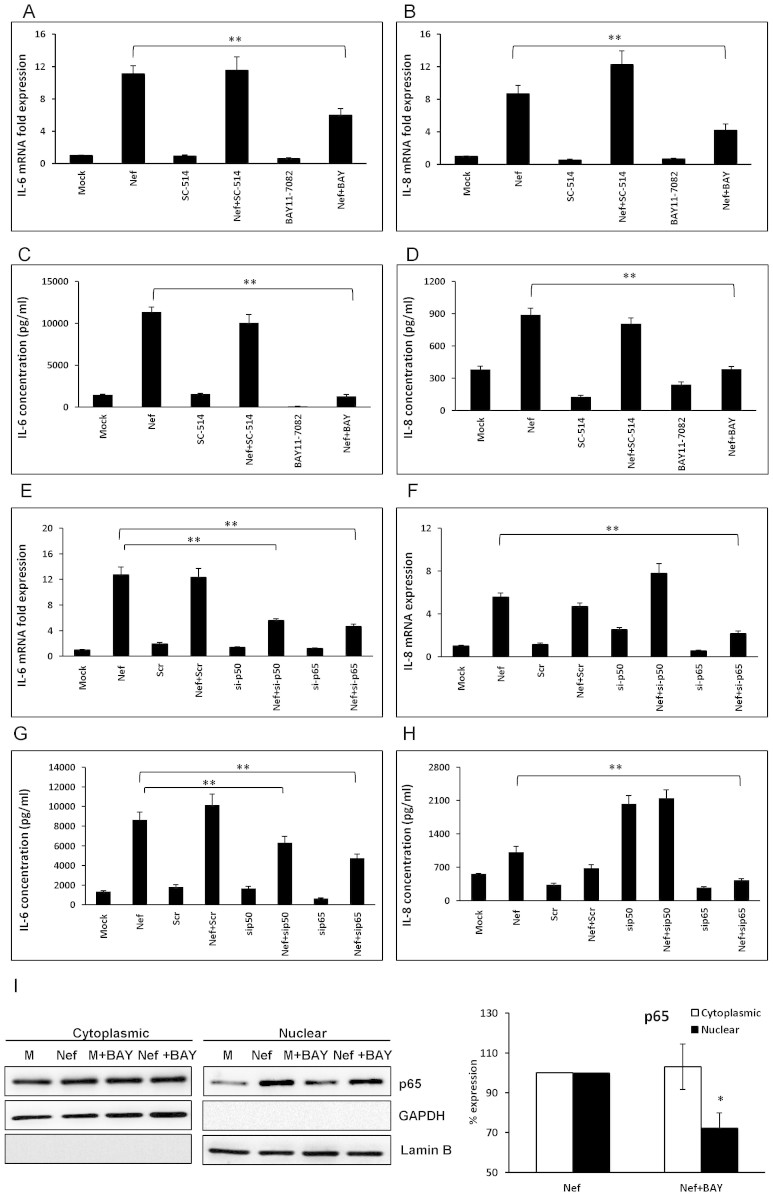
Figure 4. HIV-1 Nef induces IL-6 and IL-8 expression through the NF-κB pathway.
SVGA cells were treated with 20 μM SC-514 or 10 μM Bay11-7082 prior to the transfection. IL-6 and IL-8 mRNA (A–B) as well as protein (C–D) levels were determined at 6 and 48 h post transfection, respectively. For knockdown of p50 and p65, the cells were transfected with the siRNA followed by transfection of nef-encoding plasmid as described in Materials and Methods. The expression levels of IL-6 and IL-8 mRNA and protein were determined at 6 h and 48 h post-transfection by real-time RT-PCR (E–F) and multiplex cytokine assay (G–H), respectively. The values presented for mRNA are relative to the mock-transfected controls. In separate experiments, SVGA cells were seeded in 6-well plates and treated with 10 μM BAY11-7082 1 h prior to transfection with a plasmid encoding HIV-1 Nef. The cells were harvested at 3 h for isolation of cytoplasmic and nuclear proteins followed by western blotting for determination of p65 expression levels in the cytosol and nucleus. The figure shows one set of data that is representative of 3 independent experiments. The percentage expression of p65 is expressed relative to the nef-transfected wells at 3 h which was considered 100% (I). GAPDH was used as a loading control for cytoplasmic extracts and Lamin B was used as a loading control for nuclear extracts. Each of the bars represents mean ± SE of three independent experiments in triplicates. Statistical analysis was performed using one way ANOVA with the LSD post-hoc test in which * represents p-value ≤ 0.05 and ** represents p-value ≤ 0.01.

