
Figure 2.
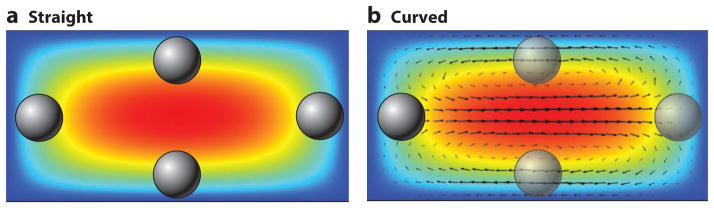
Velocity profile surface plot (red, high velocity; blue, zero velocity) (a) in a straight channel with the equilibrium positions highlighted and (b) in a slightly curved channel with vectors representing the Dean flow caused by the curvature of the channel. The opaque particles show the stable equilibrium positions, and the transparent particles are indicative of the stable positions in a straight channel made unstable under the correct conditions in a curved channel. Axial flow is into the page.