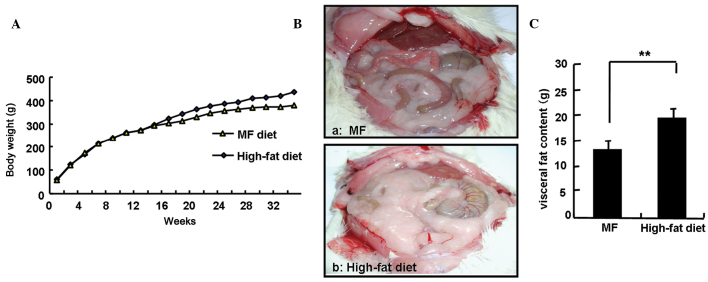
Figure 2.
Body weights and visceral fat content of the different groups of F344 rats throughout the experiment. (A) The body weights of the different groups of F344 rats. (B) Visceral image of the different groups of rats; (a) moderate fat (MF) and (b) high-fat diet groups. (C) Visceral fat content of the different groups of F344 rats, **P<0.01.

