. 2015 May 19;4:e08025. doi: 10.7554/eLife.08025

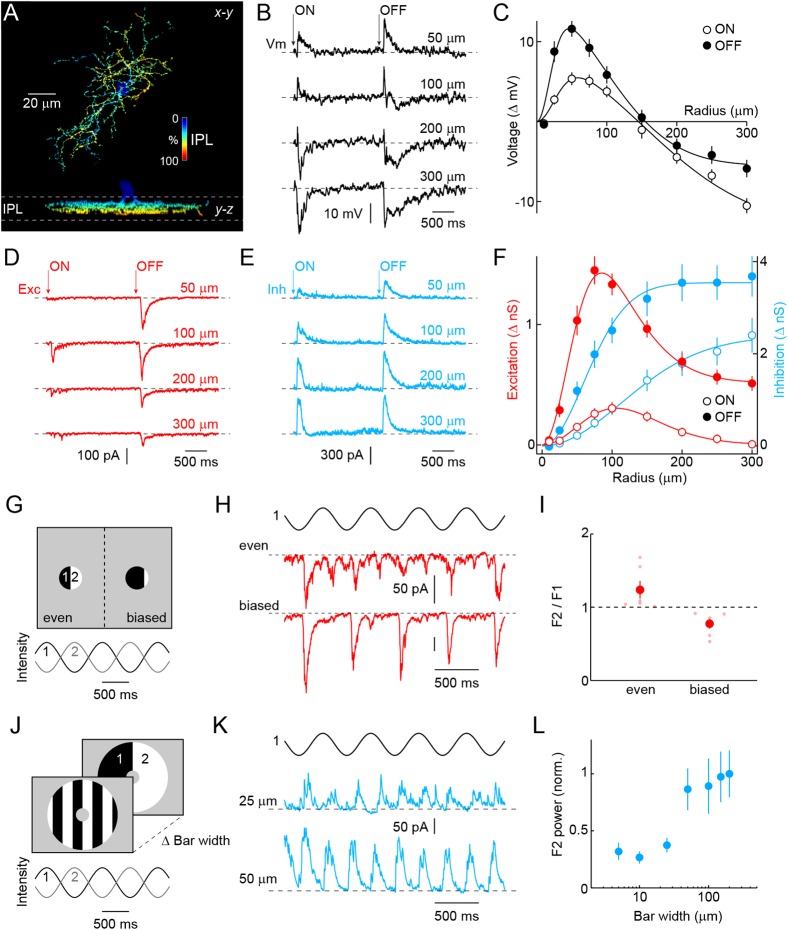
Figure 1. Morphology and receptive field properties of VG3-ACs.

(A) Orthogonal maximum intensity projections of a confocal image stack through a representative VG3-amacrine cells (ACs) labeled in VG3-CreERT2 Ai9 mice. The fluorescent signal is colored to reflect depth in the inner plexiform layer (IPL). Inset bar graph shows the mean ± SEM territory size of VG3-ACs (n = 39) measured as the area of the smallest convex polygon to encompass their arbors in a z-projection. (B, D, E) Representative voltage (B, black), excitatory postsynaptic current (EPSC) (D, red), and inhibitory postsynaptic current (IPSC) (E, blue) responses to a stimulus in which luminance in a circular area of varying size is square-wave modulated (2 s ON, 2 s OFF, transitions indicated by ‘arrows’). Stimuli were presented in pseudorandom order centered on the soma of the recorded cell. Each response trace is annotated with the radius of the stimulus eliciting it. The resting membrane potential of VG3-ACs in our recordings was −38 ± 1.2 mV (n = 26). (C, F) Summary data of the spatial ON (open circles) and OFF (filled circles) sensitivity profiles of VG3-ACs for voltage responses (C, black, n = 26) and excitatory (F, red, n = 38) and inhibitory (F, blue, n = 38) conductances. Solid lines show fits of Difference-of-Gaussian (for voltage and excitation) and single Gaussian (for inhibition) models to the data. Receptive field diameters determined from fits to voltage responses were: ON-center 73.4 ± 8.5 μm, OFF-center 40.9 ± 4.2 μm, p < 0.002, ON-surround 290.2 ± 25.5 μm, OFF-surround 213.3 ± 11.3 μm, p < 10−3. Receptive field diameters for excitatory inputs were: ON-center 137 ± 15.8 μm, OFF-center 83.1 ± 10.2 μm, p < 0.005, ON-surround 206.4 ± 14.3 μm, OFF-surround 189.8 ± 23.2 μm, p > 0.4. Diameters of inhibitory center-only receptive fields were: ON 258 ± 24.7 μm, OFF 148.2 ± 12.3 μm, p < 10−4. Response amplitudes to OFF stimuli exceeded those to ON stimuli for voltage (at 100 μm, p < 10−9), excitation (at 100 μm, p < 10−11), and inhibition (at 100 μm, p < 10−5). (G) Schematic illustration of split-field stimuli. The receptive field center is divided evenly (left) or in a biased manner (right) into two regions in which intensity is modulated by phase-shifted sine waves. (H, I) Representative EPSC traces and summary data (n = 6, p < 0.05) for even (top) and biased (bottom) split-field stimulation. (J) Schematic illustration of counter phase stimulation of surround regions. The receptive field surround is divided in bars of different size and their intensity is modulated by phase-shifted sine waves. (K) Representative IPSC traces to counter phase stimulation of bars of 25 μm (middle) and 50 μm (bottom) widths. (L) Summary data illustrating change in F2 power of inhibition as a function of bar widths. See also Figure 1—figure supplement 1 and Figure 1—figure supplement 2.

DOI: http://dx.doi.org/10.7554/eLife.08025.003

Figure 1.

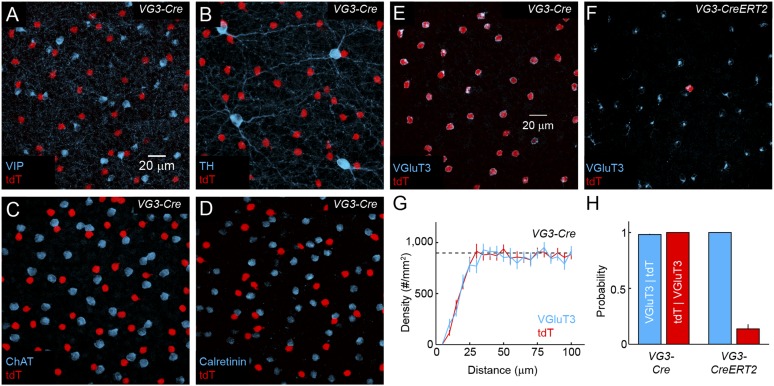
Figure 1—figure supplement 1. Distribution and specificity of VG3-Cre and VG3-CreERT2 labeling.

Figure 1—figure supplement 1.

(AF) Maximum intensity projections of confocal image stacks from the INL of VG3-Cre mice crossed to a reporter strain expressing the red fluorescent protein tdTomato (Ai9, tdT, AE) stained for vasoactive intestinal peptide (VIP, A), tyrosine hydroxylase (TH, B), choline acetyltransferase (ChAT, C), Calretinin (D) and VGluT3 (E), and of VG3-CreERT2 Ai9 mice stained for VGluT3 (F). (G) Density recovery profiles for tdTomato (n = 17 retinas) and VGluT3 (n = 10 retinas) signals in images like that shown in (A) from VG3-Cre Ai9 mice showed that VG3-ACs are arranged in regular mosaics with characteristic exclusion zones in their density recovery profiles (average densities VGluT3: 898 ± 34 cells/mm2, n = 10 retinas, tdTomato: 948 ± 37 cells/mm2, n = 17 retinas, effective radii of exclusion zones VGluT3: 18.1 ± 1.8 μm, tdTomato: 16.9 ± 0.4 μm) (Rodieck, 1991). The density of VG3-ACs was not significantly different between dorsal, ventral, nasal, and temporal quadrants of the retina (data not shown). (H) Conditional probabilities illustrating the specificity (blue bars) and completeness (red bars) of genetic labeling in VG3-Cre and VG3-CreERT2 mice. While Cre expression is highly specific in the INL, ectopic expression was observed in a small subset of cells in the ganglion cell layer (GCL) in VG3-Cre (Figure 4) but not VG3-CreERT2 mice.

Figure 1—figure supplement 2. VG3-ACs stratify in sublaminae 2 and 3 of the IPL.

Figure 1—figure supplement 2.

(A) Representative maximum intensity projection of a confocal image stack of the IPL acquired in a retinal vibratome slice stained for Calretinin (blue) and VGluT3 (red). Inner nuclear and GCLs are bordering the top and bottom, respectively, of this image. (B) Intensity profiles (mean ± SEM, n = 10 retinas) of these labels show that VG3-ACs stratify in sublamina 2 and 3 (Figure 1—figure supplement 2 and Figure 1—figure supplement 3) of the IPLs, the boundaries of which are marked by Calretinin (Wassle, 2004). Note the potential strategic importance of this laminar position. We find that OMS responses of VG3-ACs depend on convergent input from transient rectified ON and OFF bipolar cells. Figure 1—figure supplement 2 and Figure 1—figure supplement 3 contain terminals of OFF and ON bipolar cells, respectively (Wassle et al., 2009; Helmstaedter et al., 2013). Furthermore, bipolar cells with transient responses stratify near the center of the IPL (i.e., Figure 1—figure supplement 2 and Figure 1—figure supplement 3), whereas axons of bipolar cells with sustained responses stratify closer to its borders (Roska and Werblin, 2001; Baden et al., 2013; Borghuis et al., 2013). Finally, a recent study identified gradients in the linearity of glutamate release across the IPL with more rectified bipolar cells stratifying towards the middle (Borghuis et al., 2013). Stratification in Figure 1—figure supplement 2 and Figure 1—figure supplement 3, thus, positions VG3-ACs ideally to recruit input from transient rectified ON and OFF bipolar cells, as well as to form synapses with dendrites of W3-RGCs. The strategic importance of this laminar position is further corroborated by the observation that in all species examined, VG3-ACs and LED RGCs stratify near the center of the IPL (Berson et al., 1998; Roska and Werblin, 2001; Famiglietti, 2005; van Wyk et al., 2006; Zhang et al., 2012).

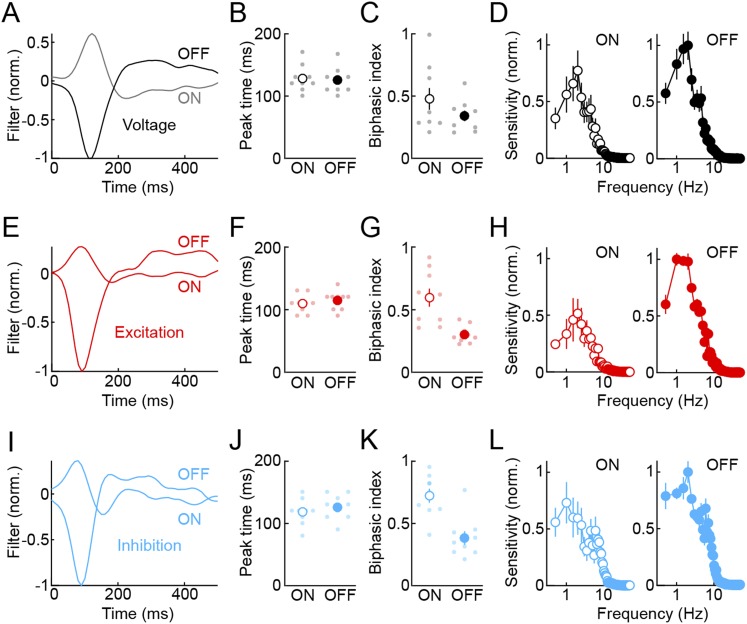
Figure 1—figure supplement 3. Temporal receptive fields of VG3-ACs.

Figure 1—figure supplement 3.

To characterize temporal receptive fields of VG3-ACs, we presented white noise stimuli (refresh rate: 30 Hz, RMS contrast: 40%) to receptive field centers (voltage and excitation) or surrounds (inhibition) and adapted a principal-component-based approach to recover linear filters describing temporal sensitivity to ON and OFF stimuli, respectively (‘Materials and methods’) (Greschner et al., 2006; Gollisch and Meister, 2008). (A, E, I) Linear ON and OFF filters constructed from voltage (A, black), excitation (E, red), and inhibition (I, blue) traces of representative VG3-ACs. (B, C, F, G, J, K) Peak times (B, F, J) and biphasic indices (C, G, K, ON: |trough|/peak, OFF: peak/|trough|) of ON and OFF filters. Dots show data from individual cells and circles (error bars) indicate mean (± SEM) of the population. Peak times of ON and OFF filters were not significantly different for voltage (B, black, n = 9, p > 0.2), excitation (F, red, n = 9, p > 0.4), and inhibition (J, blue, n = 9, p > 0.08). However, ON filters were more biphasic than OFF filters for excitation (G, red, p < 0.002) and inhibition (K, blue, p < 0.002), but not voltage responses (B, black, p > 0.1). (D, H, L) Temporal frequency tuning functions calculated from Fourier amplitudes of ON (left panels) and OFF (right panels) filters for voltage (D, black), excitation (H, red), and inhibition (L, blue) responses show response suppression at high- and low-stimulus frequencies and illustrate the higher sensitivity of VG3-ACs and their synaptic inputs to OFF compared to ON stimuli. Circles (error bars) show mean (± SEM) of the population.