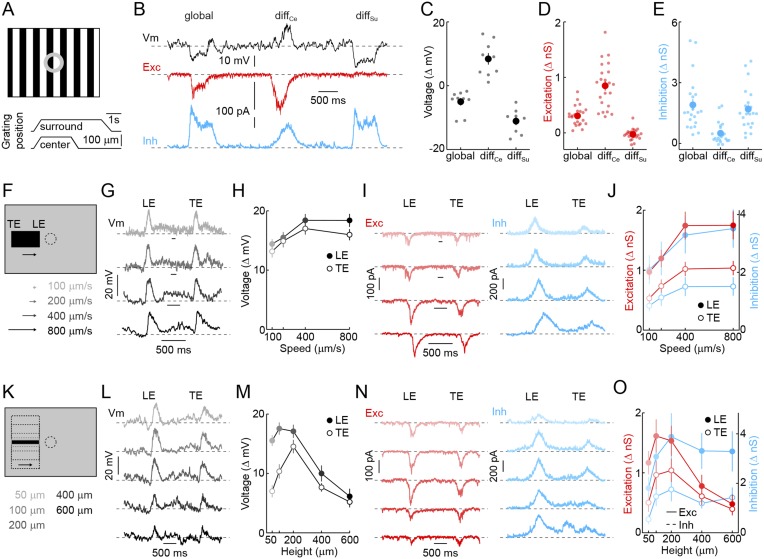
Figure 2. Detection of object motion by VG3-ACs.
(A) Schematic illustrating texture motion stimuli. Two square-wave gratings (bar width: 50 μm), one covering the center and one the surround region of the VG3-AC receptive field, are separated by a gray annulus. During stimulus presentation, both gratings move first together (global) and then separately (differential center motion denoted by diffCe and differential surround motion by diffSu). (B) Representative voltage (black), EPSC (red), and IPSC (blue) traces recorded during presentation of the stimulus shown in (A). (C–E) Summary data of voltage (C), excitatory (D), and inhibitory (E) response amplitudes to global, differential center (diffCe), and differential surround (diffSu) motion stimuli. Dots show data from individual cells (voltage n = 9, excitation n = 22, inhibition n = 22, p < 10−7 for all comparisons), and circles (error bars) indicate mean (±SEM) of the respective population. (F) Schematic illustrating a stimulus in which a narrow bar (height: 200 μm) is moved across the receptive field of a VG3-AC at a variety of speeds annotated in (F) and encoded by color saturation throughout. (G, I) Representative voltage (G, black), EPSC (I, red), and IPSC (I, blue) traces recorded in response to bars moving at different speeds. Time points when the leading (LE) and trailing edges (TE) of the bar are in the center of the receptive field are indicated. (H, J) Summary data of voltage (H, black), excitation (J, red), and inhibition (J, blue) response amplitudes. Circles (error bars) indicate the mean (±SEM) of these data sets (voltage n = 32, excitation n = 8, inhibition n = 5). (K) Schematic illustrating a stimulus in which bars of varying height are moved across the receptive field of a VG3-AC at a constant speed (400 μm/s). Bar heights are encoded in by color saturation as indicated in (K). (L–O) Representative voltage (L, black), EPSC (N, red), and IPSC (N, blue) traces. Summary data of voltage (M), excitation (O, red), and inhibition (O, blue) response amplitudes reveal suppression of edge responses for voltage and excitation, but not inhibition at greater bar heights (comparison of 200 μm and 600 μm, voltage n = 32, p < 10−7 excitation n = 8, p < 0.001, inhibition n = 5, p > 0.14). Circles (error bars) indicate the mean (±SEM) of these data sets. See also Figure 1—figure supplement 3.


