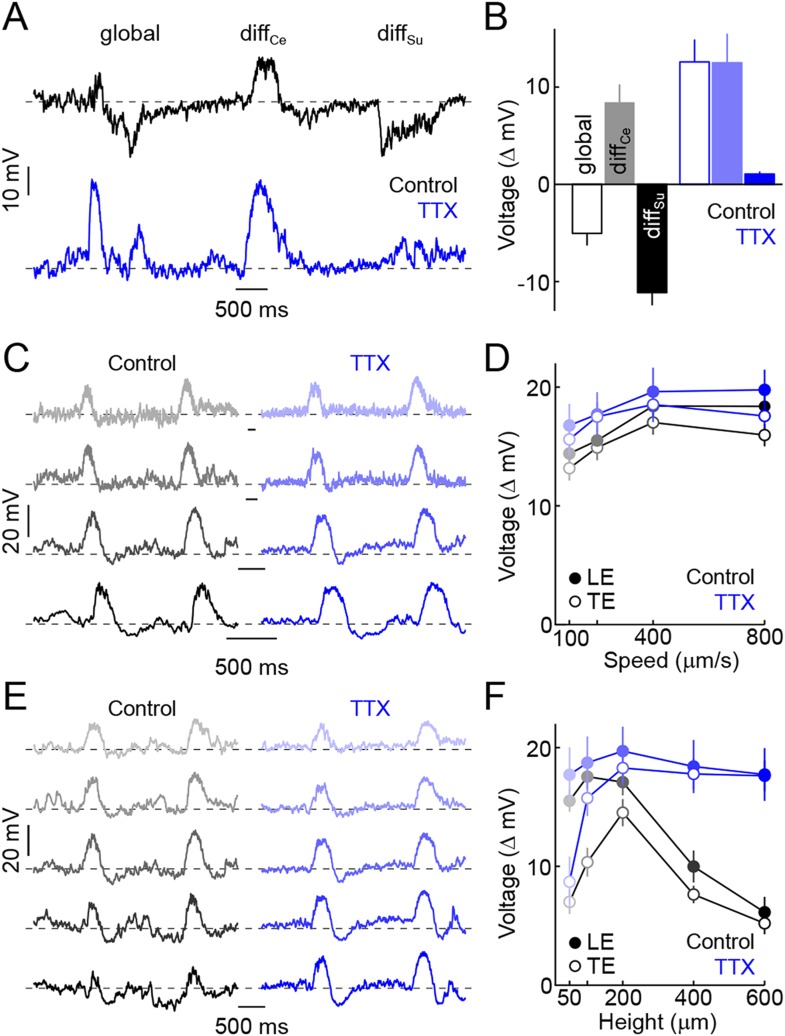
Figure 3. Spiking ACs mediate surround suppression of VG3-ACs.
(A) Representative voltage traces recorded from a VG3-AC during presentation of the texture motion stimulus illustrated in Figure 2A in control conditions (top, black) and in the presence of TTX (bottom, blue). (B) Bars (error bars) indicating mean (±SEM) response amplitudes to different segments of the texture motion stimulus in control conditions (left, black) and in the presence of TTX (right, blue). TTX abolishes the suppression by global and differential surround motion (control n = 9, TTX n = 5, p < 10−4 for TTX vs control) but does not affect the response to differential center motion (p > 0.2 for TTX vs control). (C, D) Representative traces (C) and summary data (D, mean ± SEM) for voltage responses of VG3-ACs to narrow dark bars (height: 200 μm) moving at different speeds (100 μm/s, 200 μm/s, 400 μm/s, and 800 μm/s from top to bottom), encoded by matching color saturation in (C) and (D) in the absence (left, black) or presence (right, blue) of TTX. TTX did not significantly alter responses to narrow bars irrespective of their speed (control n = 32, TTX n = 7, p > 0.1 for all comparisons). (E, F) Exemplary traces (E) and population data (F, mean ± SEM) for voltage responses of VG3-ACs to dark bars of different heights (50 μm, 100 μm, 200 μm, 400 μm, and 600 μm from top to bottom) moving at 400 μm/s, indicated by matching color saturation in (E) and (F), in the absence (left, black) or presence (right, blue) of TTX. Surround suppression is canceled by TTX leading to increased responses to larger bars (at 600 μm, control n = 32, TTX n = 7, p < p < 10−4).

