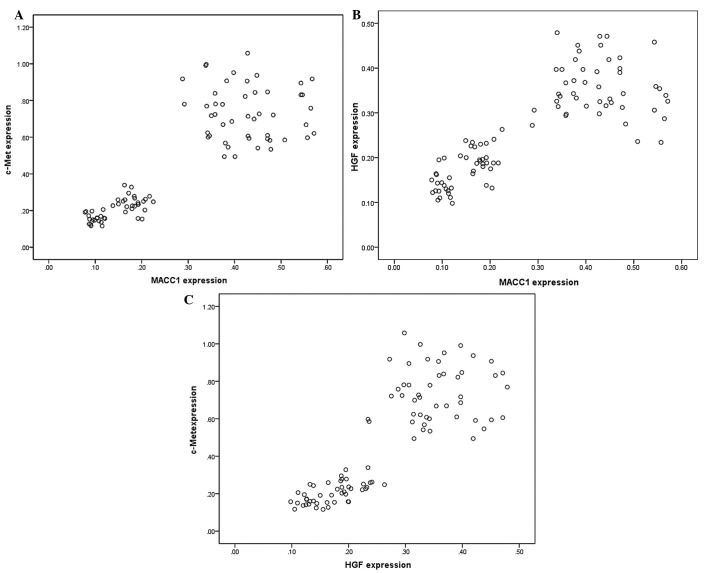
Figure 2.
Comparative distribution of the expression levels of c-Met, hepatocyte growth factor (HGF) and metastasis-associated in colon cancer-1 (MACC1). Two-sample correlation plots of (A) c-Met and MACC1 expression levels (r=0.849, P<0.01), (B) MACC1 and HGF expression levels (r=0.810, P<0.01) and (C) HGF and c-Met expression levels (r=0.831, P<0.01).

