
Figure 2.
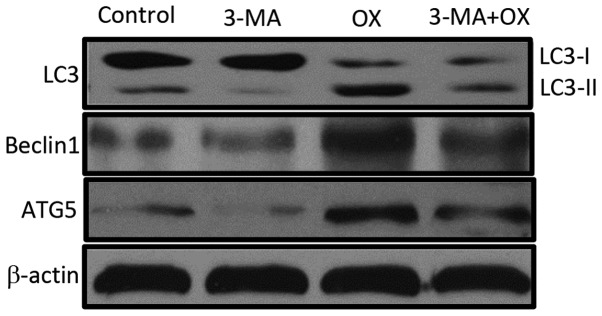
OX induces the expression of autophagy proteins in CT26 cells. Equal quantities of cell lysate from CT26 cells administered with different treatment regimes was used for western blot analysis to detect the expression levels of LC-3, Beclin1, ATG5 and β-actin (loading control). 3-MA, 3-methyladenine; OX, oxaliplatin; LC3, microtubule-associated protein light chain 3; ATG5, autophagy related 5.