
Figure 7. Reduced expression of DNA repair genes correlates with mutant p53 expression in cancer patients.
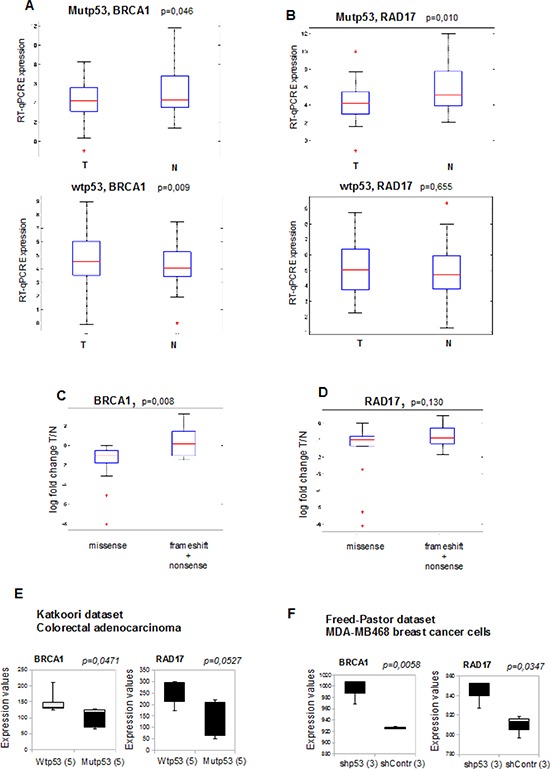
(A, B) BRCA1 and RAD17 mRNAs were analyzed by RT-qPCR on a group of 63 HNSCC tumor samples and on their normal counterparts. The expression of BRCA1 (a) and RAD17 (b) mRNAs (log base 2 scale) were analyzed in association of TP53 gene mutational status in HNSCC samples. Mutp53: tumors carrying mutant p53 (n = 32); wtp53: tumors with wild-type TP53 (n = 31). (C, D) Association of BRCA1 (c) and RAD17 (d) mRNA expression (log fold change T/N) with tumors carrying TP53 missense mutations (leading to protein stabilization) with a selected group of tumors carrying nonsense and frameshift mutations not leading to protein stabilization (by sequence prediction analysis and by immunohistochemistry, as previously described in Ganci et al., Omics 2011). On each box, the central red mark is the median, the blue edges of the box are the 25th and 75th percentiles, the black lines extend to the most extreme data points not considered outliers, and outliers are plotted individually as +. (E) The box plot represents BRCA1 (left panel) and RAD17 (right panel) mRNA expression of 5 wild type p53-and 5 mutant p53-carrying colorectal adenocarcinoma patients. Data from Katkoori et al. (2012) were obtained from www.oncomine.org website.45,46 Data are presented as log base 2 scale. (F) The box plots represent BRCA1 (left panel) and RAD17 (right panel) and mRNA expression in three separate cell clones of sh-p53 (shp53) and sh-control (shContr) MDA-MB-468 breast cancer cells (mutp53R273H). Data from Freed-Pastor et al. (2012) were obtained from www.oncomine.org website [45, 47]. Data are presented as log base 2 scale. In all box plots, the bottom (black) and top (grey) of the box are always the first (25th percentile) and third quartiles (75h percentile), and the band inside the box is always the second quartile (the median).