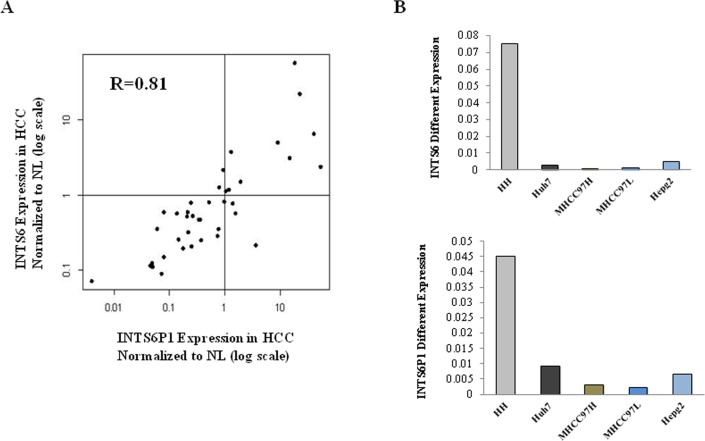
Figure 1. INTS6 and INTS6P1 are putative tumor suppressors in HCC.
(A) The expression levels of INTS6 and INTS6P1 are assayed in 39 pairs of HCC and paired normal liver tissue (NL). X-Axis – INTS6P1 expression levels in HCC tissues normalized to paired NL tissues. Y-Axis – INTS6 expression levels in HCC tissues normalized to paired NL tissues. Both X- and Y-axis are in log units. INTS6 and INTS6P1 are expressed at lower levels in approximately 70% HCC vs. NL samples (in the figure, the dots representing specimens located in the left lower quadrant). Moreover, the expression of INTS6 is positively correlated with INTS6P1 in HCC. The R value (correlation coefficient value) is 0.81 (Spearman correlation). Data presented is normalized to respective gene expression in corresponding NL tissues. (B) The expression level of INTS6 and INTS6P1 is lower in HCC cells (Huh7, MHCC97H, MHCC97L, and HepG2) compared to normal human hepatocytes (HH).

