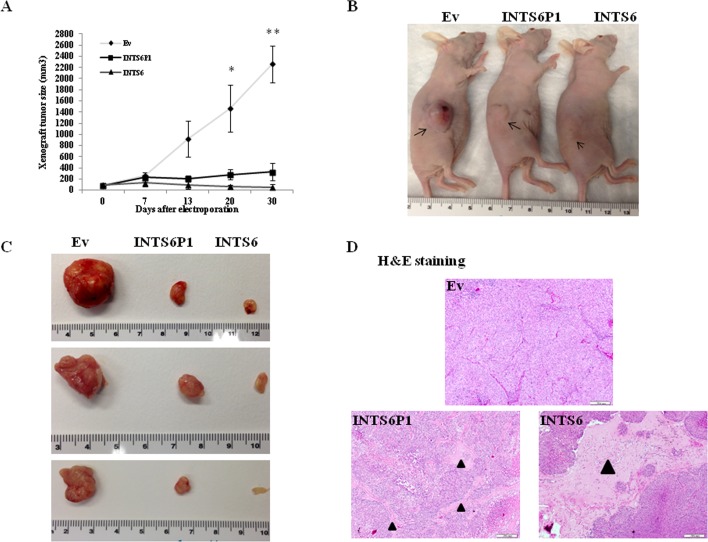
Figure 3. INTS6P1 and INTS6 exert tumor suppressive activity in vivo.
(A) Tumors established in nude mice grow significantly less when INTS6 or INTS6P1 are up-regulated in vivo. At day 20, there was a statistically significant difference in tumor size between Ev (control) and tumors electroporated with either INTS6 plasmid (p = 0.023) or INTS6P1 plasmid (p = 0.037). At day 30, there was a statistically significant difference in size of tumors between Ev (control) group and tumors electroporated with either INTS6 plasmid (0.006) or INTS6P1 plasmid (p = 0.0038). Error bars represent mean ± SD. (B, C) Representative images demonstrate the size of control tumors (Ev) compared to tumors treated in vivo with INTS6 or INTS6P1. (D) The H&E staining of tumors show lower cross sectional cancer component in tumors treated with INTS6 or INTS6P1 in vivo. The black triangles indicate a higher percent of tumor stroma (and lack of cancer cells) in tumors treated with INTS6 or INTS6P1.

