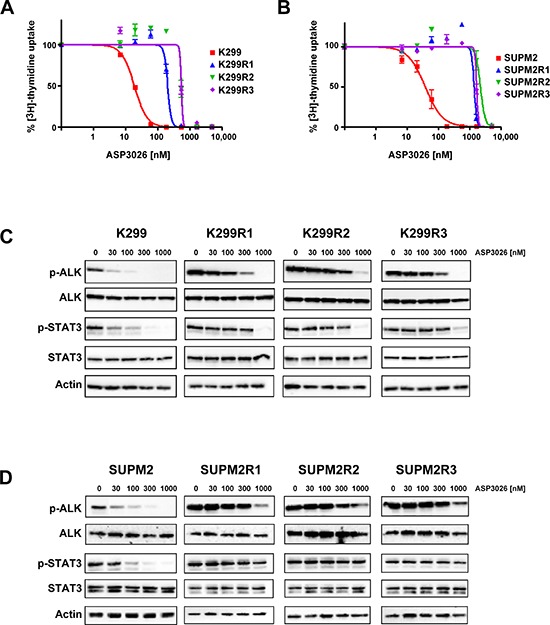
Figure 1. Characterization of ASP3026-resistant cells.

(A–B) Dose-response curves generated by 3H-Thymidine incorporation assay with native cells and drug-resistant cell lines. Karpas299 (K299) and Karpas299-derived resistant cells (K299R1, R2, R3) are shown in panel A. SUPM2 cells and their derived resistant clones are shown in B. The calculated IC50 values are reported in Table 1. (C–D) Western blot analysis of ALK and STAT3 phosphorylation inhibition by ASP3026, at the indicated nanomolar concentrations, in parental and resistant cells. Panel C, K299; panel D, SUPM2. Total ALK, STAT3 and actin are shown for loading normalization.
