
Figure 2. Analysis of Ba/F3-NPM/ALK cell lines sensitivity to ALK inhibitors.
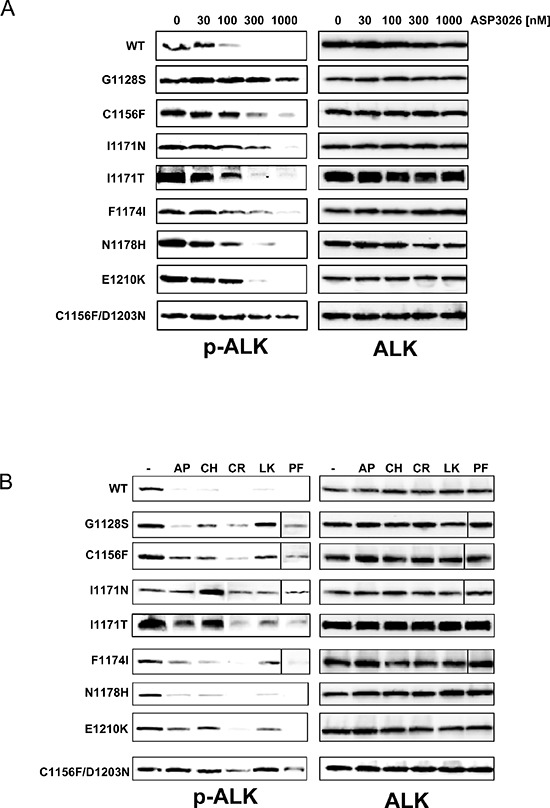
(A) Western blot analysis of ALK phosphorylation inhibition by ASP3026, at the indicated nanomolar concentrations, in wild-type and mutant Ba/F3-NPM/ALK cell lines. (B) Analysis of phospho-ALK inhibition by low-dose ALK inhibitors. The lowest inhibitors concentrations causing complete suppression of pALK signal in WT cells were used. AP, 10 nM AP26113; CH, 10 nM alectinib; CR, 300 nM crizotinib; LK, 30 nM ceritinib; PF, 10 nM PF-06463922. Total ALK is shown on the right-hand side of panels A and B, as loading control.