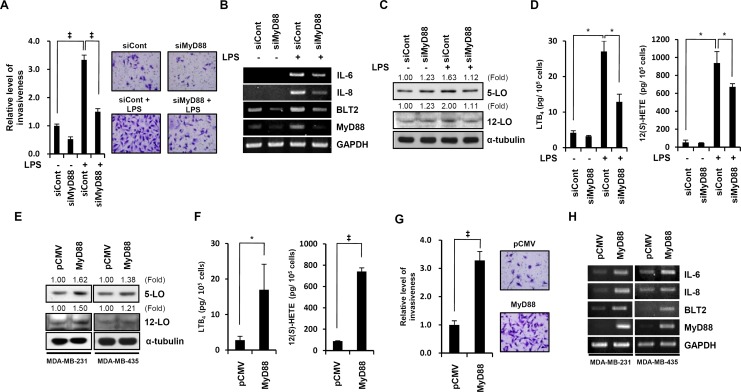
Figure 4. LPS-enhanced invasive potential is through a MyD88-BLT2-liked cascade.
(A) MDA-MB-231 cells were transfected with MyD88 (siMyD88) or control (siCont) siRNAs. After 24 h, the cells were assayed for invasiveness in the presence or absence of LPS (1 μg/ml) for 24 h. Scale bars, 50 μm. (B and C) Cells were treated as in (A) and then assayed by semiquantitative RT-PCR for IL-6, IL-8, BLT2, and MyD88 mRNA levels (B) or immunoblot to determine the protein levels of 5-LO, 12-LO, and α-tubulin (loading control) (C). (D) Cells were treated as in (A), and then, the culture supernatants were assayed for amounts of LTB4 (left panel) and 12(S)-HETE (right panel) by ELISA. (E) MDA-MB-231 cells (left panel) and MDA-MB-435 cells (right panel) were transfected with an expression plasmid for MyD88 or the empty plasmid (pCMV) and then incubated for 24 h. Then, the cell lysates were subjected to immunoblot analysis for 5-LO, 12-LO, and α-tubulin. (F) Cells were transfected as in (E), and then, the quantity of LTB4 and 12(S)-HETE in the culture supernatants was measured by ELISA. (G) Cells were transfected as in (E) and then the cells were assayed for invasiveness. Scale bars, 50 μm. (H) Cells were transfected as in (E), RNA was isolated and subjected to semiquantitative RT-PCR analysis for IL-6, IL-8, BLT2, MyD88 and GAPDH (loading control) mRNAs. Semiquantitative RT-PCR data are representative of three independent experiments, and all quantitative data are shown as the mean ± SD of three independent experiments. p < 0.05, ‡p < 0.005.

