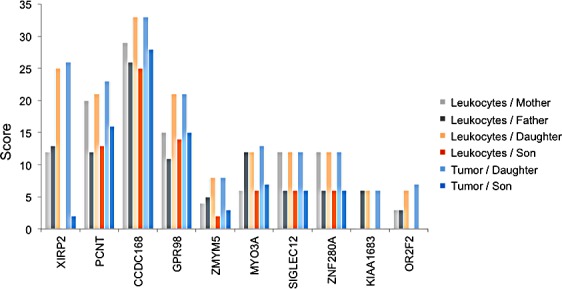
Figure 4. Genes with SNV accumulation in the daughter.

The 6 bar charts show for 10 genes that are substantially more affected in the daughter as compared to the son how many homozygous and heterozygous variants can be found in leukocytes of parents (two leftmost bars per gene), leukocytes of siblings (two middle bars per gene), and GBM DNA of the siblings (two right bars per gene). The bar height corresponds to the computed cumulative score.
