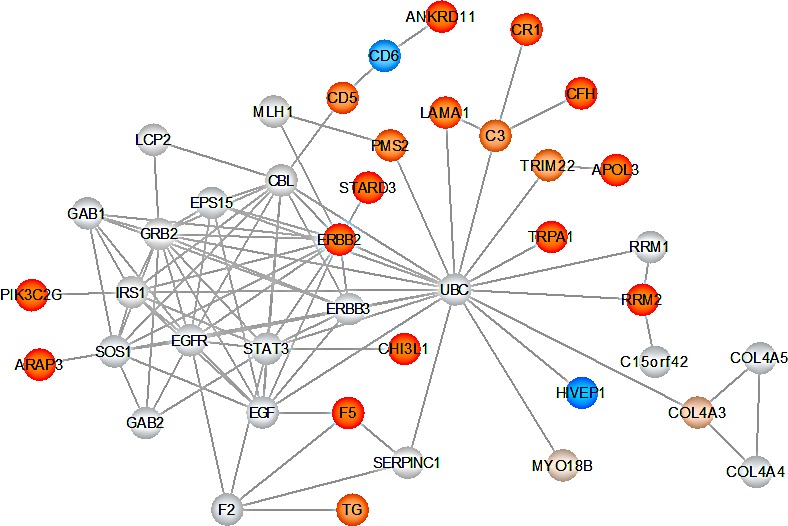
Figure 6. Key GBM network.

The graphic shows the core-connected component of the interaction network derived from the STRING database. Nodes are colored with respect to the fold change of the score in children and parents. Genes with elevated scores are indicated in orange. Increased color intensity indicates an increased SNV accumulation in the respective gene. Genes with low scores are indicated in blue. Genes indicated in gray are not scored but added by STRING to the network.
