
Figure 3. GSK3α, but not GSK3β regulates cell survival and proliferation of PC3 cells in athymic nude mice tumor xenografts.
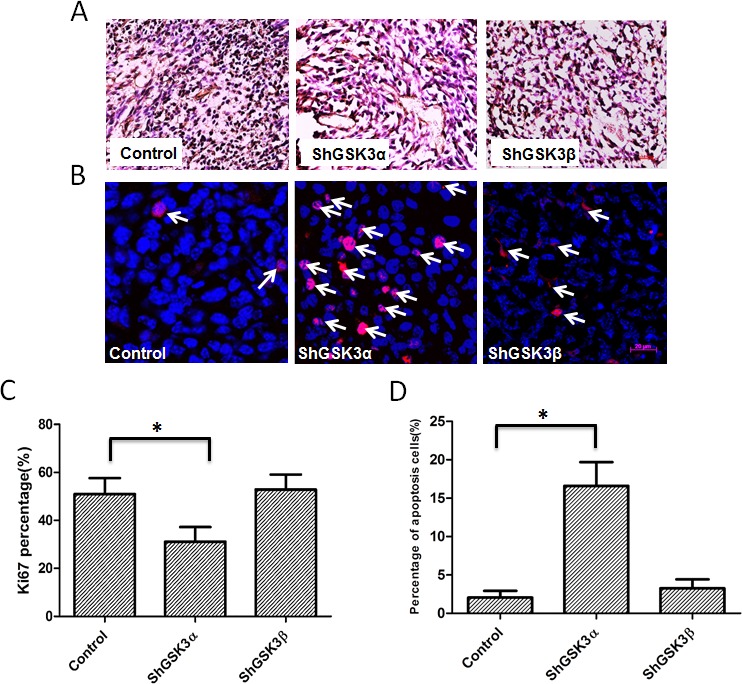
(A) Microscopic images of control, GSK3α and GSK3β ShRNA expressing PC3 tumor xenograft sections subjected for ki67 staining showing proliferating cells. (B) Fluorescent microscopic images of control, GSK3α and GSK3β ShRNA expressing PC3 tumor xenograft sections subjected for TUNEL assay showing apoptotic cells. (C) Bar graph showing percentage of proliferating PC3 cells in tumor xenografts transfected with control, GSK3α and GSK3β ShRNA, normalized to the total number of cells (n=6). (D) Bar graph showing percentage of apoptotic cells in PC3 cells in tumor xenografts transfected with control, GSK3α and GSK3β ShRNA, normalized to the number of nuclei (n=6). Data is shown as Mean + SD; *p <0.05.