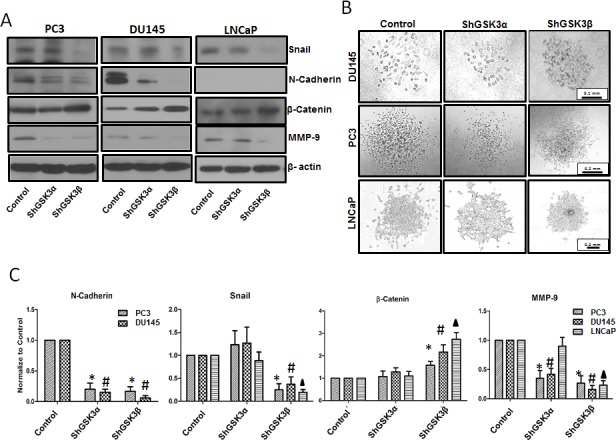
Figure 8. GSK3β predominantly regulates prostate cancer epithelial-to-mesenchymal transition via a Snail/N-Cadherin/β-Cateinin pathway.

(A) Western blot images showing the effect of GSK3α and GSK3β gene silencing in PC3 (left panel), DU145 (center panel) and LNCaP (right panel) cells on the expression of epithelial and mesenchymal specific genes Snail, N-Cadherin, β-catenin and MMP-9. (B) Microscopic images of PC3 (upper panel), DU145 (center panel) and LNCaP (lower panel) cells displaying phenotypic changes between cobblestone-like epithelial morphology and typical mesenchymal-like morphology with silencing of GSK3α and GSK3β gene expression as compared to control cells. (C) Densitometry analysis of Western blot images showing the effect of GSK3α and GSK3β gene silencing in PC3, DU145 and LNCaP cells on the expression of Snail, N-Cadherin, β-catenin and MMP-9 (n=3). Data is shown as Mean + SD; *,#,▲p<0.05 for PC3, DU145 and LNCaP cells, respectively.
