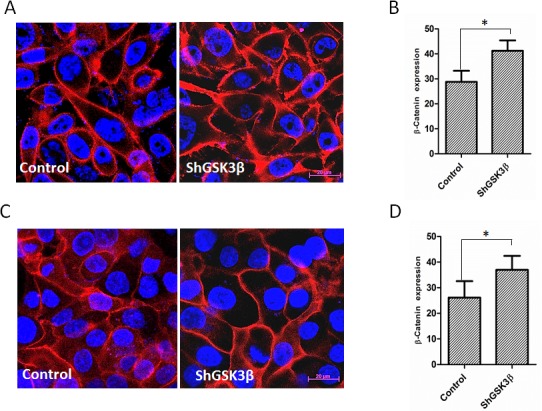
Figure 9. GSK3β gene silencing results in increased expression and membrane localization of β-catenin.

(A) Fluorescent images on ShControl and ShGSK3β PC3 cells probed with anti-β-catenin antibodies showing the intracellular localization of β-catenin in the presence of 10% FBS. (B) Quantification of the total expression of β-catenin in ShControl and ShGSK3β PC3 cells in optical density (OD) units as measured by the NIH Imgae J software. (C) Fluorescent images on ShControl and ShGSK3β DU145 cells probed with anti-β-catenin antibodies showing the intracellular localization of β-catenin in the presence of 10% FBS. (B) Quantification of the total expression of β-catenin in ShControl and ShGSK3β DU145 cells as measured in OD units by the NIH Imgae J software (n=9). Data is shown as Mean + SD; *p <0.01.
