
Figure 5. TGF-β pathway activity: an analysis of the Cancer Genome Atlas (TCGA) network.
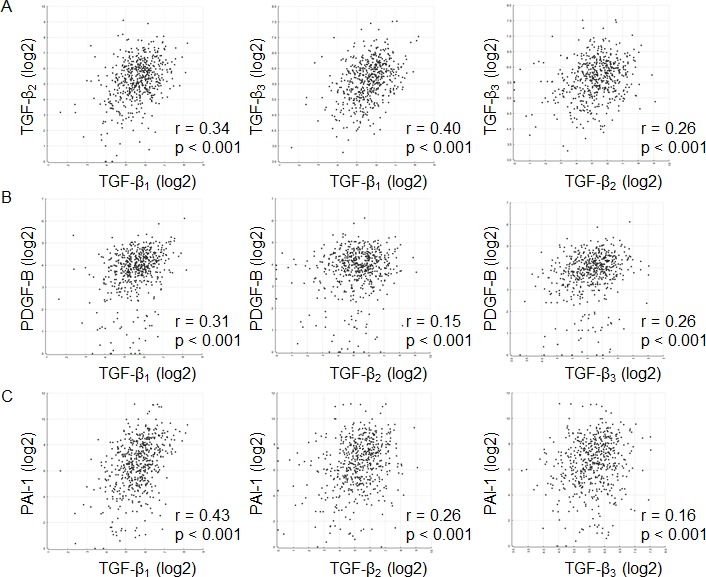
A, Correlation is shown among the TGF-β isoforms. Correlation was assessed using mRNA data of TGF-β1 or TGF-β2 or TGF-β3 and mRNA data of PDGF-B (B) or PAI-1 (C). Two-tailed Spearman test coefficients (r) and significances (p) are indicated. Data are obtained from the TCGA network.