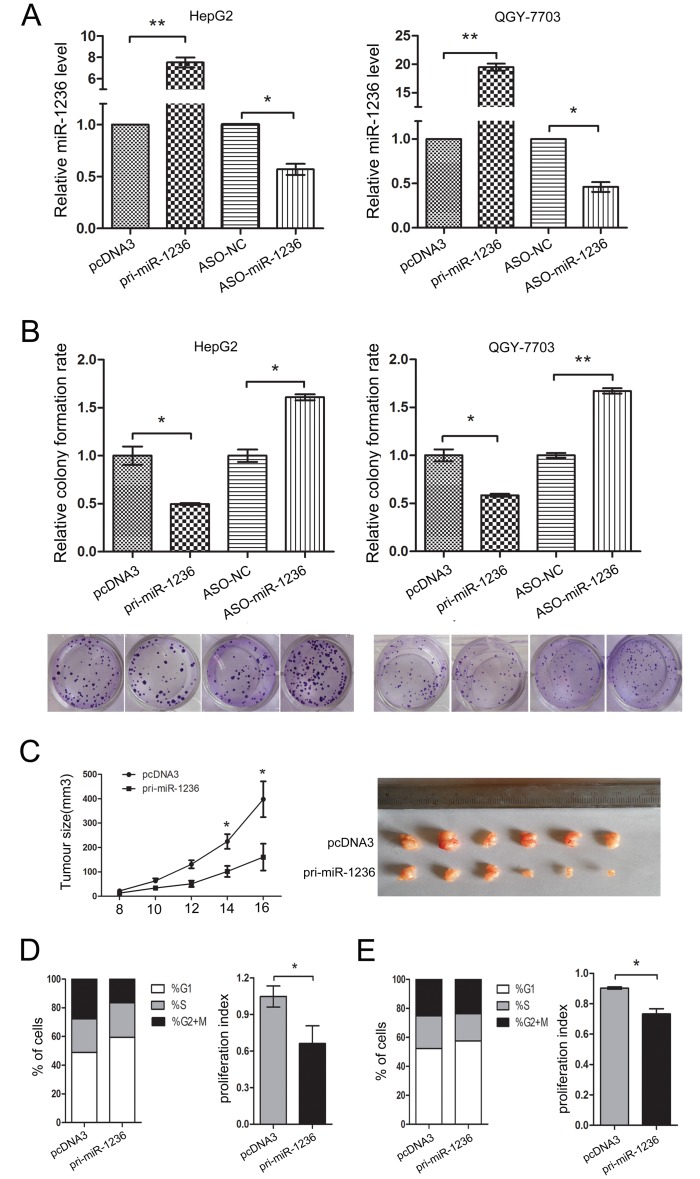
Figure 2. miR-1236 inhibits the proliferation of HCC cells in vitro and in vivo and delays the cell cycle progression.
(A) The efficiency of pcDNA3/pri-miR-1236 and ASO-miR-1236 plasmids in HepG2 and QGY-7703. (B) Colony formation assays were performed to test the influence of miR-1236 on the proliferation of HepG2 and QGY-7703 cells. The colony formation rate = (the number of colonies/the number of cells plated) × 100%. (C) The nude mouse tumor xenograft model was utilized to study the effect of miR-1236 on tumor growth in vivo. The tumor size was measured 8 days after injection every other day; the tumor growth curve is shown on the left. The tumor volume = length × width2×1/2, *p<0.05, n=6 (Student's t test). The mice were euthanized, and the tumors were isolated 16 days after implantation (Right). (D, E) The cell cycle progression of HepG2 (D) and QGY-7703 (E) cells was analyzed by flow cytometry. The chart shows the population of cells in G1-, S- and G2/M–phase (Left) as well as the proliferation index (Right) of the groups transfected with pcDNA3/pri-miR-1236 and pcDNA3. proliferation index = (S + G2/M)/G1 (S, G2/M and G1 are the percentages of cells in S-phase, G2/M-phase and G1-phase, respectively) *p<0.05, **p<0.01. All error bars indicate the means±SDs. All experiments were repeated at least three times.

