
Figure 3. HSET overexpression correlates to increased aggressiveness and poorer clinical outcomes.
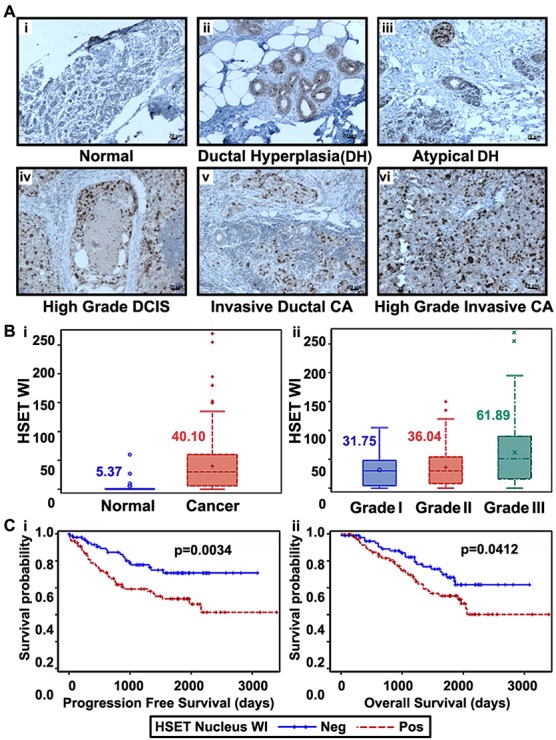
Immunohistographs showing HSET expression in (Ai) normal breast, (Aii) ductal hyperplasia, (Aiii) atypical ductal hyperplasia, (Aiv) ductal carcinoma in-situ, (Av) invasive ductal carcinoma, low-grade, (Avi) invasive ductal carcinoma, high-grade. Brown (DAB) color shows HSET staining. Intensities of nuclear HSET staining were quantified using image analysis Aperio Image Scope v.6.25 software. A weighted index score (WI) for HSET expression was calculated and was assessed in 339 breast cancer and 19 normal samples. Box-whisker plots showing (Bi) HSET WI score in normal breast and tumor samples, (Bii) HSET WI score across Grade I (n=40), Grade II (n=237) and Grade III (n=62) breast cancer samples. (Ci) Probability of progression free survival of 163 breast cancer patients with HSET nuclear expression above or below the median HSET weighted index (WI) value referred to as positive and negative, respectively (p=0.0034). (Cii) Probability of overall survival of 163 patients with positive and negative HSET weighted index (p=0.0412). Statistical analysis was conducted using SAS Version 9.3. Scale bar=10 μm.