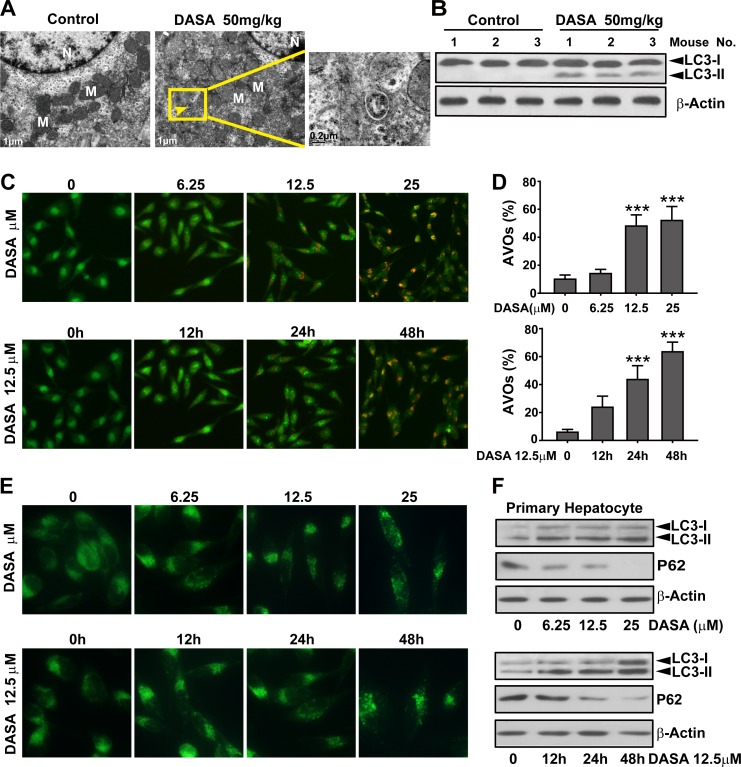
Figure 2. Autophagy is involved in dasatinib-driven hepatotoxicity both in vitro and in vivo.
A. Live tissues from the nude mice shown in Figure 1 were collected. Electron micrographs of livers from mice after dasatinib treatment (scale bars=1 μm). Autophagosomes were observed. Insets show a higher magnification view of autophagic vesicles (scale bars=0.2 μm). Yellow arrows denote autophagosomes. B. Total liver lysates were analyzed by western blot using an anti-LC3 antibody. (C-F) Hepatocytes were treated with dasatinib (12.5 μM) as indicated for 12, 24 or 48 hours or with different concentrations of dasatinib (0, 6.25, 12.5 and 25 μM) for 24 hours. C. The formation of AVOs was observed. Magnification 100×. D. The percentage of AVO development in total cells was quantified by FACS and calculated from 3 independent experiments. E. The formation of fluorescent particles were measured by MDC staining and shown as the representative results from 3 independent experiments. Magnification: 200×. F. Total cell lysates were subjected to western blot. Data are expressed as the mean ± SEM. ***, P<0.001 for significant differences compared to the vehicle control. DASA=dasatinib.

