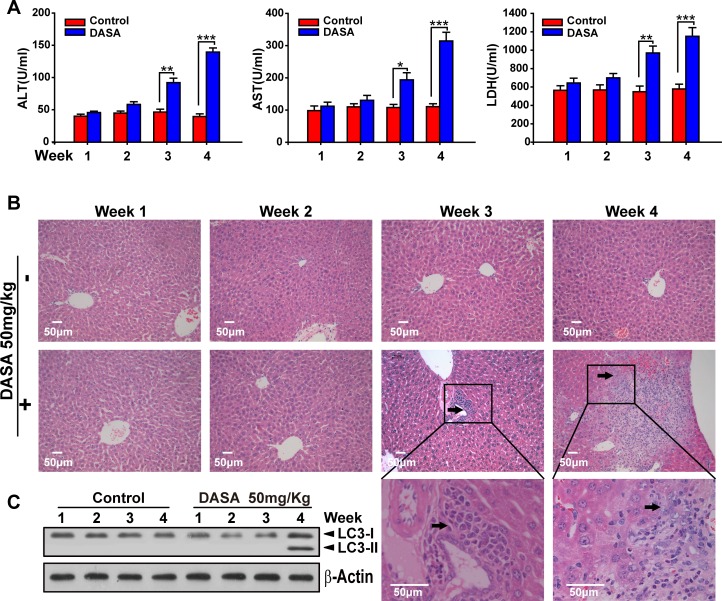
Figure 4. Dasatinib induced the liver injury and autophagy sequence.
ICR mice were randomly divided into two groups (n=16) and were treated either with saline or dasatinib (50 mg/kg) for 4 weeks, and sacrificed 4 of 16 each group every week. A. Serum was analyzed for ALT, AST and LDH level. B. Liver sections were stained with hematoxylin and eosin for histopathological analysis (magnification=×100 or 400, scale bar=50 μm). Black arrows denote necrotic hepatocytes. C. Protein extracts of liver tissues were immunoblotted with the specified antibodies for LC3 and β-actin. Data are expressed as the mean ±SEM. Statistical analysis was performed by t-test where appropriate. DASA = dasatinib.

