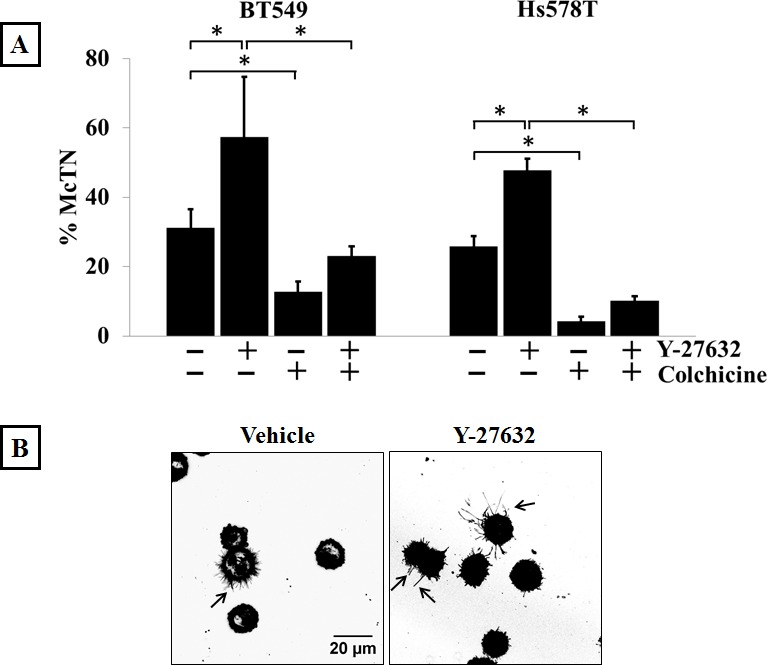
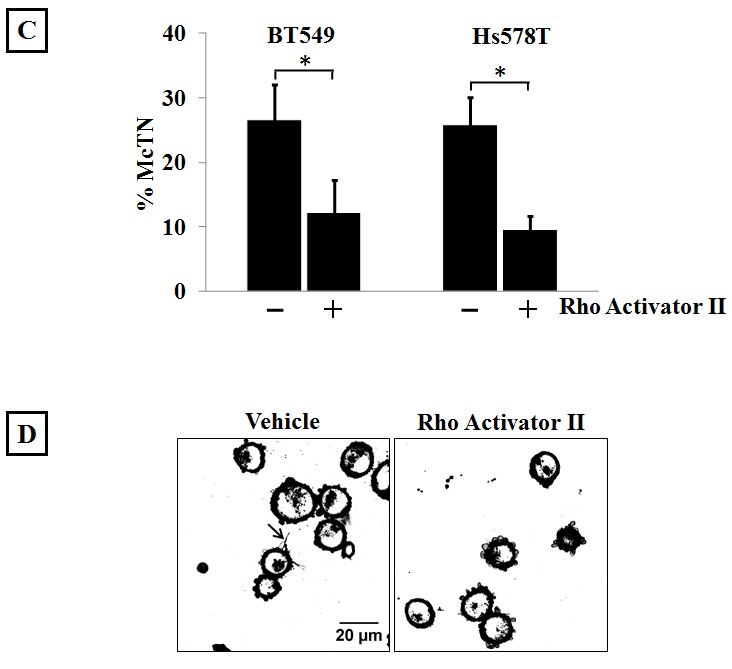
Figure 3. Modulation of Rho/ROCK activity regulates McTN formation.


A) Suspended BT549 and Hs578T cells stained with CellMask orange and scored blindly for the presence of McTNs show that 10μM Y-27632 treatment for 1 hour significantly increases the frequency of McTNs compared to vehicle-treated cells in both the cell lines tested. Treatment with 50μM colchicine, a microtubule-depolymerizing drug, significantly decreases McTN formation when used singly or in combination with Y-27632. Columns represent the mean +/− SD of three independent experiments in each of which 100 cells were scored in triplicate (900 cells total for every treatment group) (p<0.05, t-test, black asterisks). B) Representative live-cell confocal microscope maximum intensity projection images of CellMask orange stained suspended BT549 cells show more cells with McTNs in Y-27632-treated group compared to the vehicle control group (arrows) (60x magnification). C) 4μg/ml Rho Activator II treatment for 3 hours decreases McTN formation in BT549 and Hs578T cells. Columns represent the mean +/− SD of three independent experiments in each of which 100 cells were scored in triplicate (900 cells total for every treatment group) (p<0.05, t-test, black asterisks) D) Representative live-cell confocal microscope maximum intensity projection images of CellMask orange stained suspended BT549 cells show loss of McTN formation in Rho Activator II-treated cells compared to vehicle-treated cells (60x magnification).
