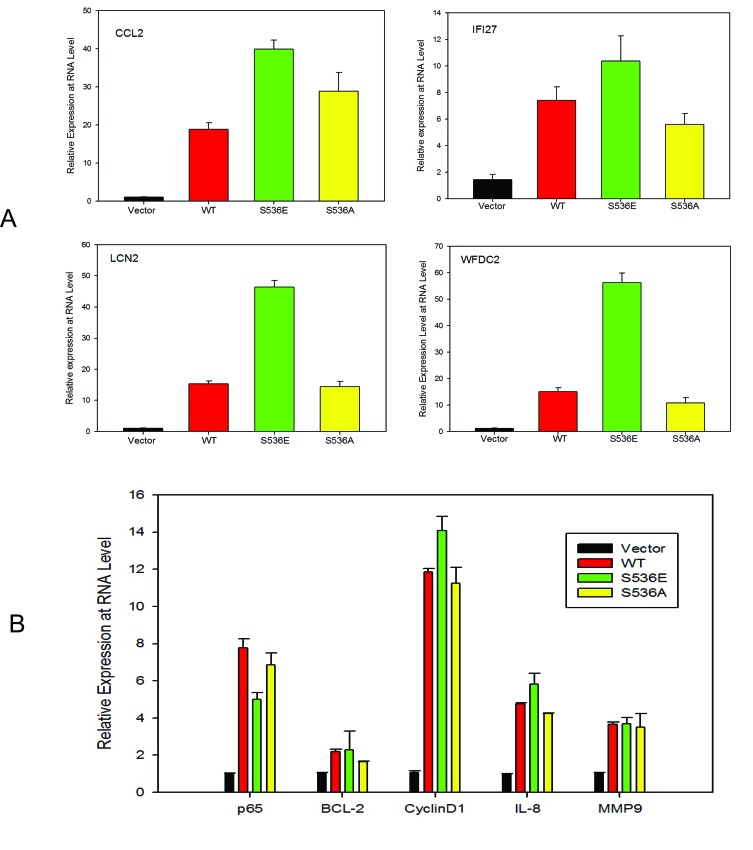
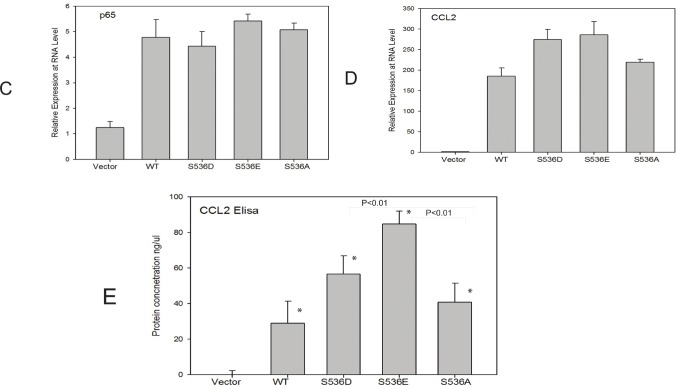
Figure 3. p536 regulated gene expression validation.
A. Quantitative RT-PCR validation of selected genes in vector-, WT p65-, S536E- and S536A-PNT1a cells from the list of heat map. Relative expression of CCL2, IFI27, LCN2 and WFDC2 are shown. Mean with standard deviation of triplicate determinations is shown. β-Actin was used for normalization; B. Quantitative RT-PCR validation of well known p65 regulated genes of BCL-2, cyclinD1, IL-8 and MMP9 in PNT1a cell lines; Mean with standard deviation of triplicate determinations is shown. β-Actin was used for normalization; C-D. Total p65 and CCL2 expression are accessed by real-time PCR in LNCaP cells, + vector, +WT p65, +S536D, +S536E and +S536A; β-Actin was used for normalization; E. Secreted CCL2 proteins in culture medium by LNCaP cell lines were detected by Elisa. Experiment was repeated three times. Mean with standard deviation of triplicate is shown. * was indicated a statistically significant result when compared to control group. P values were shown on the top of bars between active and NP p536 groups.


