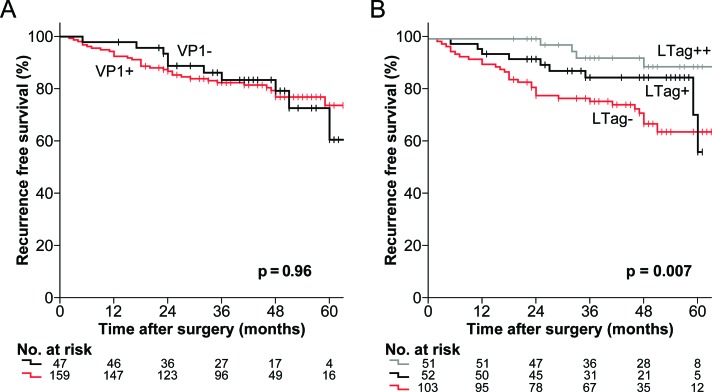
Figure 2. Kaplan-Meier estimates of RFS by BKPyV serostatus in patients who underwent RP for primary prostate cancer.
(A) Estimates of RFS stratified by the established cutoff for VP1 seropositivity (OD492 = 0.11) (black line = VP1- and red line = VP1+). (B) Estimates of RFS stratified by the 50th and the 75th percentile LTag IgG OD492 ratio (1.0226 and 1.1478, respectively) (grey line = LTag++, black line = LTag+ and red line = LTag−). All p values were two-sided log-rank tests.

