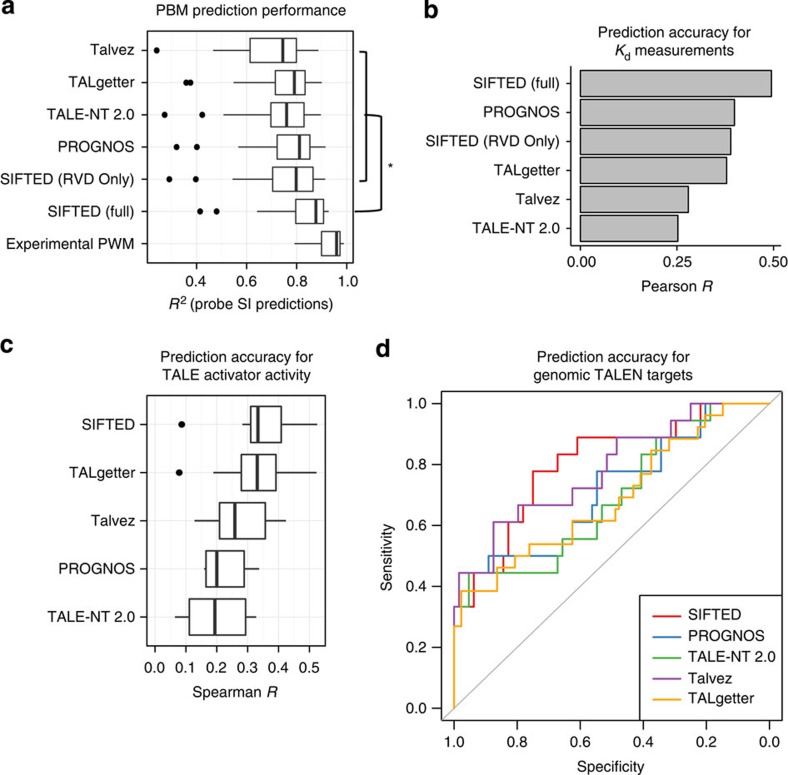
Figure 3. SIFTED predictive model performance.
(a) Comparison of prediction accuracy of PWMs derived by different methods. The box plots show how well the PBM probe intensities for each protein are predicted by the PWMs generated by SIFTED and other methods. Two versions of SIFTED are shown: one that only models repeats independently (‘SIFTED (RVD Only)') and one that considers all repeat context features (‘SIFTED (Full)'). Experimental PWMs are those derived from the PBM data. (*) The brackets highlight a subset of statistically significant differences between the full SIFTED model and each of the models shown inside the top bracket (P<10−6, Wilcoxon signed-rank test). The box plots shows the median and the first and third quartiles. Whiskers extend to data points not considered outliers, whereas outliers are shown as individual points. Data are considered outliers when they are 1.5 times the interquartile range (IQR) higher than the third quartile, or 1.5 * IQR lower than the first quartile. (b) Prediction accuracy for relative binding affinity. PWMs derived from existing tools or from SIFTED (as in a) were used to predict relative Kd values for a single TALE protein27,35. The bars display the Pearson correlation coefficient between observed and predicted log(Kd) values. (c) Validation of TALE activator binding specificity predictions by comparison to TALE activator activity data reported in Mali et al22. The five predictive methods were used to score all reported binding sites up to three mismatches away from the predicted target. These scores were compared with an expression score associated with that binding site using Spearman correlation. (d) Validation of TALEN-binding specificity predictions by comparison to cell-based TALEN activity data, reported in Guilinger et al20. The five methods shown were used to predict the binding of TALEN pairs to genomic target sites. The receiver operating characteristic curves show the sensitivity and specificity of each method for distinguishing genomic sites that showed nuclease activity (that is, indels) and those that did not.

