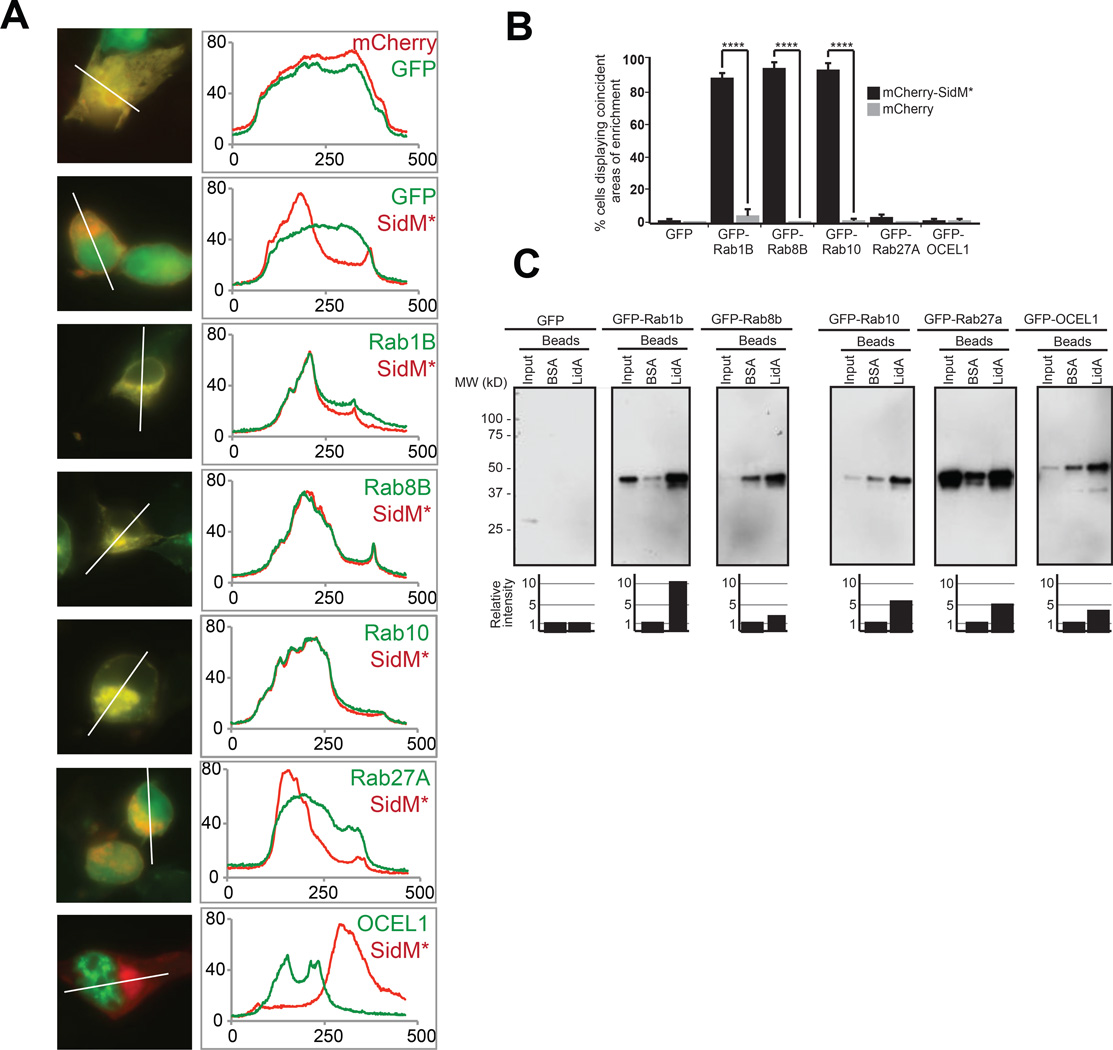
Figure 6.
Host target validation using co-localization and co-precipitation analysis. (A) COS1 cells were transiently transfected with plasmids encoding mCherry-SidMD110/112A and GFP-tagged target candidates, and protein colocalization 16 hours after transfection was determined by fluorescence microscopy. Left panels show representative fluorographs of doubly transfected cells; the right panel shows line scans denoting pixel intensity of red and green fluorescent signals along the line indicated in the image to the left. Scale bar, 1µm. (B) Quantification of (A) showing the percentage of cells with coincident areas of GFP- and mCherry-enrichment. Data are mean ± SD (error bars) for three independent experiments. ****P < 0.0001 (two-tailed t-test). (C) Pulldown assay. Beads coated with BSA (control) or purified recombinant LidA were used to precipitate GFP-tagged prey proteins from 293T cell lysate. Inputs (1%) and eluates (50%) were separated by SDS-PAGE, and prey proteins were detected by immunoblot using anti-GFP antibody. Estimated molecular weights of prey proteins: GFP (27kD), GFP-Rab1B (52kD), GFP-Rab8B (51kD), GFP-Rab10 (50kD), GFP-Rab27A (52kD), GFP-OCEL1 (56kD). The graph below each panel is a quantification of the co-precipitation data. The amount of prey protein was determined by densitometry and is shown relative to nonspecifically-bound prey protein eluted by BSA-coated beads for each group, arbitrarily set at 1. The values are representative of at least two independent experiments.

