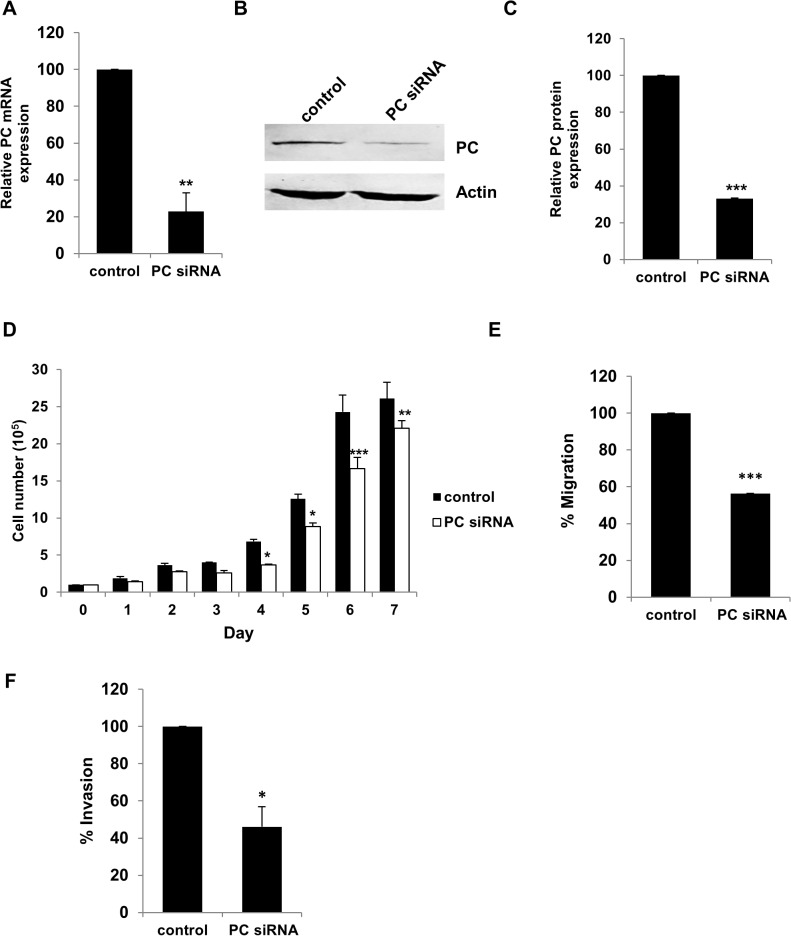
Fig 7. Suppression of PC expression in MDA-MB-435 cells reduces their proliferation, migration and invasion.
PC mRNA expression in the knockdown MDA-MB-435 was quantitated by Q-PCR (A). Western blot analysis of MDA-MB-435 cells transfected with PC siRNA (PC siRNA) or scrambled control (Control) (B). The band intensity of PC in B was quantitated and normalized with β-actin band and expressed as relative PC expression (C). Proliferation assay (D), migration assay (E) and invasion assay (F) of the PC knockdown MDA-MB-435 cells. The statistical analyses in B, C, E and F were conducted using student’s t-test while in D was conducted using ANOVA test. *P < 0.05, **P < 0.01, ***P < 0.001.

