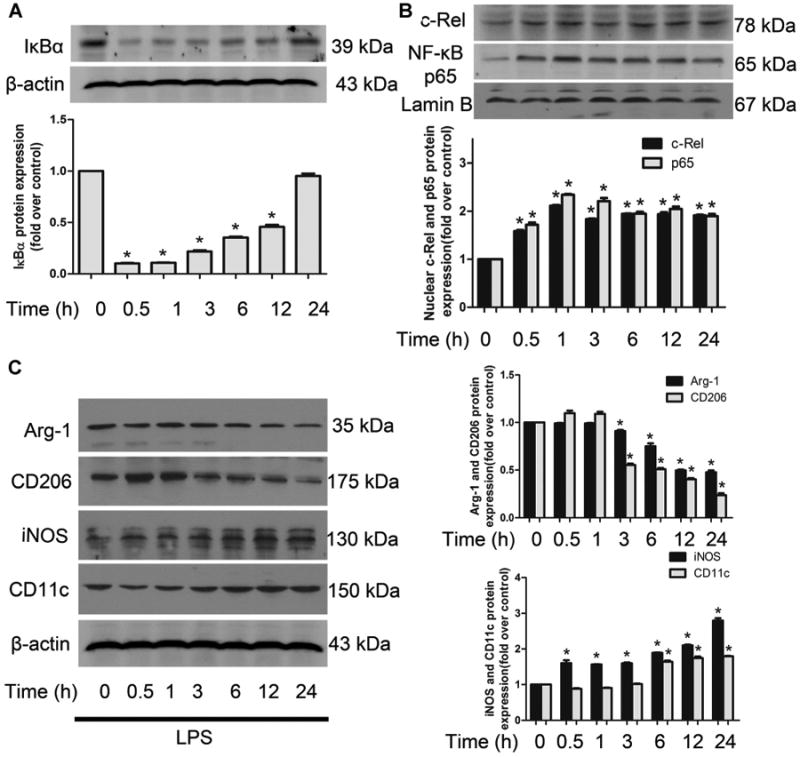
Fig 1.

Time course for LPS-induced NF-κB activation and macrophage polarization. A–C: Representative immunoblots and quantitation for NF-κB activation (IκBα, NF-κB p65 and c-Rel) and macrophage phenotype markers (CD11c and iNOS for M1, CD206 and Arg-1 for M2) induced by LPS at different time points in RAW 264.7 cells. Data are shown as mean ± SEM from three independent experiments. *P < 0.05 versus control.
