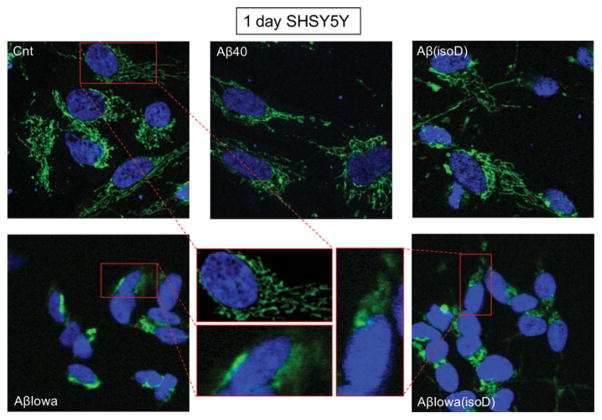
Figure 4. Mitochondrial CytC release in SH-SY5Y cells after 1 day of peptide challenge.
Immunocytochemical evaluation of CytC in SH-SY5Y following 1 day of treatment with 50 μM Aβ40, Aβ(isoD), Aβ-Iowa or Aβ-Iowa(isoD). Green fluorescence highlights CytC localization; punctate staining represents mitochondrial localization, whereas diffuse green staining indicates release into the cytoplasm. Blue fluorescence represents nuclear DNA counterstained with DAPI. Magnification 40 ×. Middle panel illustrates enlarged cell images highlighting CytC subcellular localization. Cnt, control.

