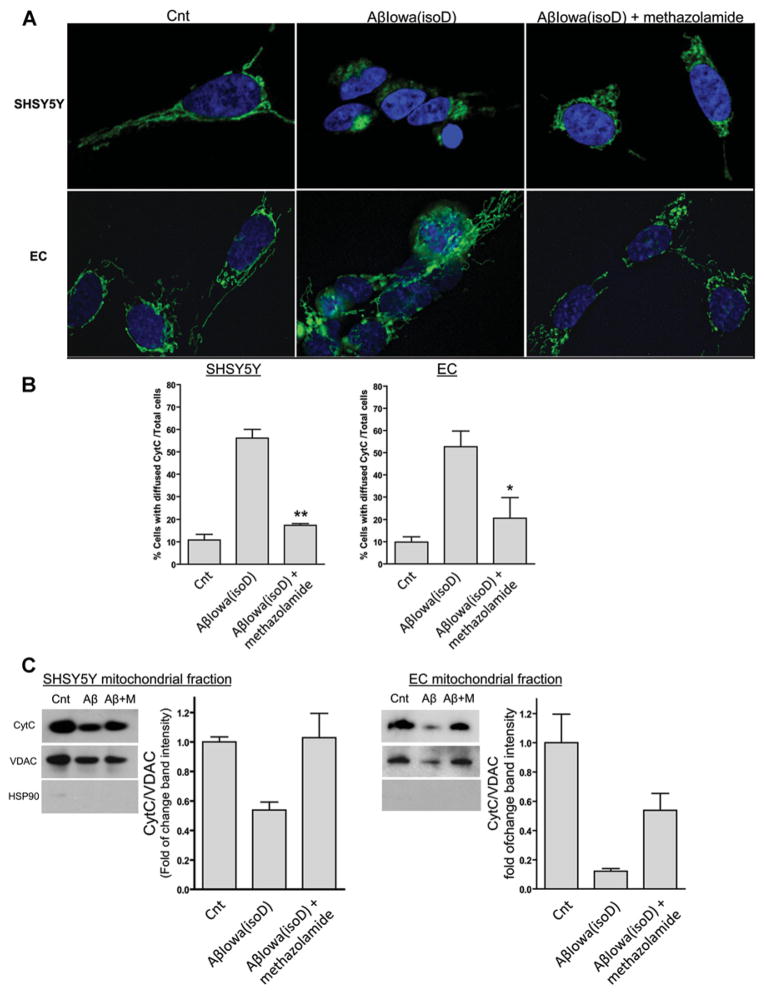
Figure 7. Protective effect of methazolamide on Aβ-mediated mitochondrial CytC release.
SH-SY5Y and ECs were treated with 50 μM Aβ-Iowa(isoD) in the presence (300 μM) and absence of methazolamide, followed by CytC visualization by deconvolution microscopy and WB after separation of mitochondrial fractions. (A) Immunofluorescence evaluation. Green signal illustrates CytC staining as above. Magnification 100×. (B) Quantification of cells depicting cytoplasmic CytC localization. Histograms represent the number of cells exhibiting cytoplasmic CytC diffuse staining by immunofluorescence, expressed as a percentage of total cells. Results illustrate cell counts in at least three 40× magnification fields. Bars represent means ± S.E.M. (C) WB analysis of mitochondrial fractions. CytC immunoreactivity in SH-SY5Y and ECs treated with Aβ-Iowa(isoD) in the presence and absence of methazolamide was assessed in mitochondrial fractions [(+) for VDAC; (−) for the cytoplasmic protein HSP90 (heat-shock protein 90)], prepared as described above. Histograms on the right-hand panels of each WB represent the densitometric quantification of the CytC band intensity normalized to the respective VDAC bands. Data are presented as means ± S.E.M. for at least three independent experiments. In (C) Aβ indicates Aβ-Iowa(isoD), M represents methazolamide (300 μM) and Cnt represents control.

