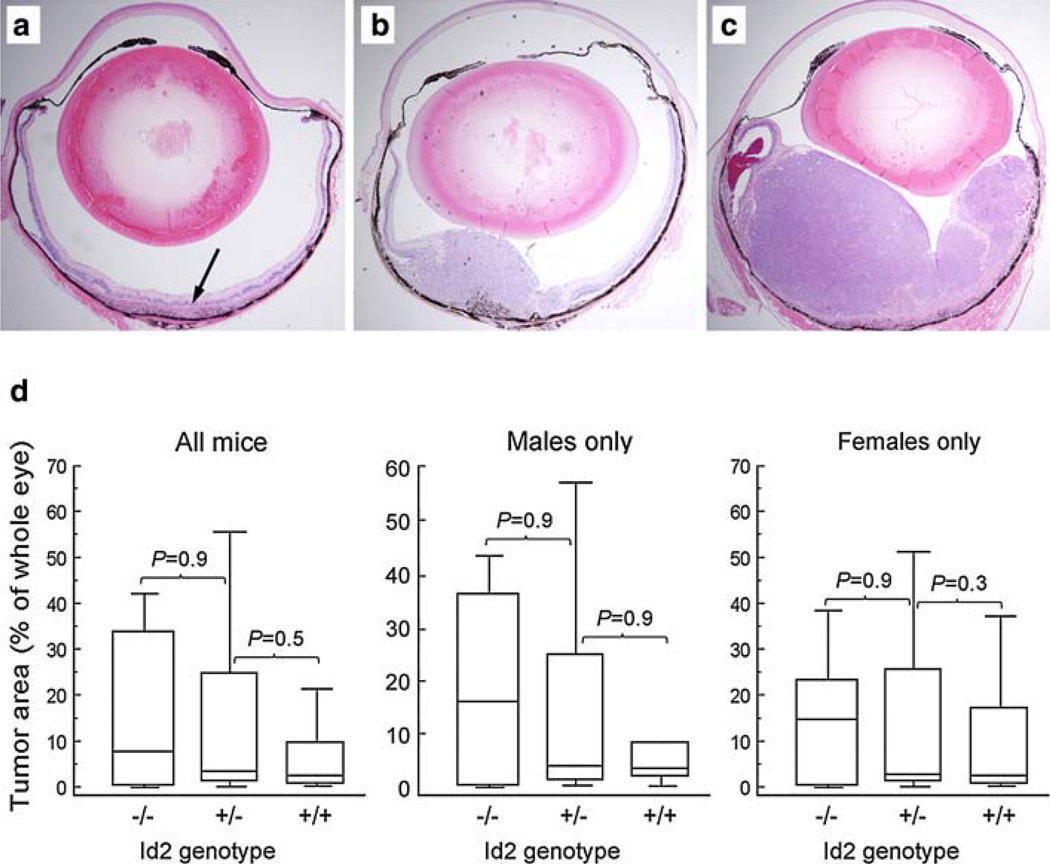
Fig. 1.
Histopathologic photomicrographs of intraocular primary tumors demonstrating a typical small tumor (arrow) (a), medium tumor (b), and large tumor (c). Original magnification 4×. d Box-and-whiskers plots showing a primary intraocular tumor area as a percentage of the total area of the eye. Males and females are analyzed separately as indicated. The central box represents the values from the 25 to 75th percentile. The middle line represents the median. A line extends from the minimum to the maximum value. P values were calculated using the Mann–Whitney nonparametric method

