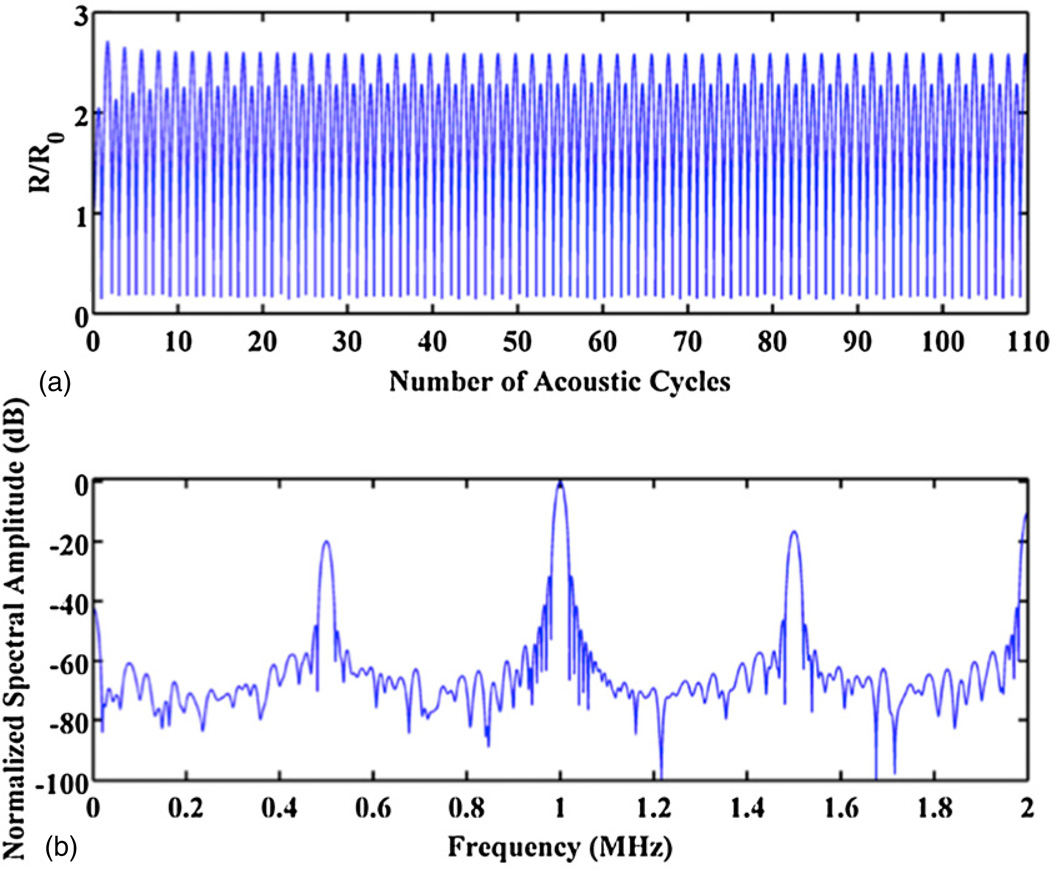
Figure 1.
(a) Representative calculated radius–time curve using the Gilmore equation. The driving frequency is 1 MHz, R0=3.0 µm, and the peak rarefactional pressure is 0.26 MPa. The host fluid is blood at atmospheric pressure. (b) FFT of the bubble’s radiated pressure waveform, normalized to the amplitude of the fundamental component. The subharmonic component at 500 kHz is ~20 dB lower than the fundamental, and thus the subharmonic threshold has been reached.

