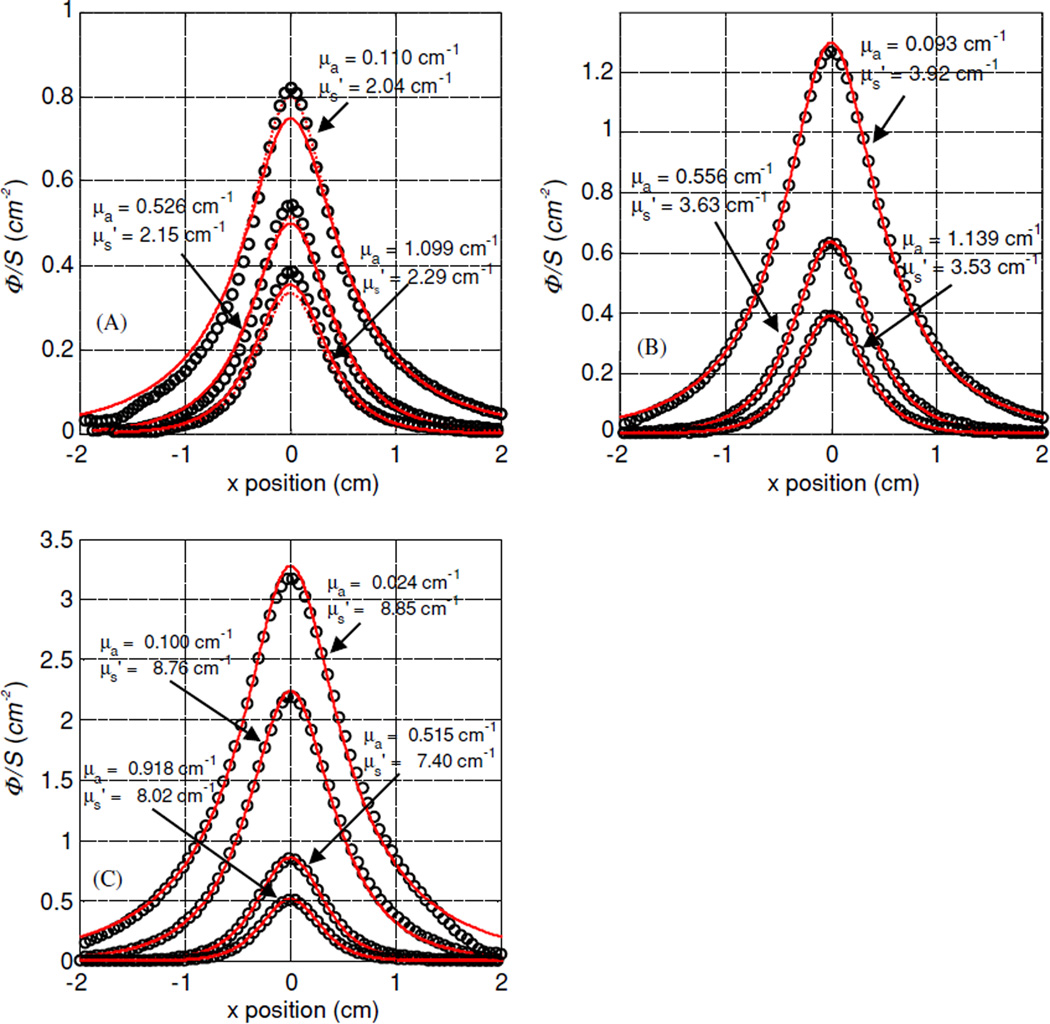
Figure 10.
Measured fluence rate per unit source power for different scattering media using 0.23, 0.53 and 1.14% Liposyn concentrations and 0.002, 0.012 and 0.023% ink concentrations at light-detector distance of 0.5 cm. (A) , (B) , (C) . The solid lines are the fit using diffusion theory. The optical properties determined using the diffusion theory are shown next to each fit. The dotted lines represent the fluence rate predicted by the P3 theory for these optical properties.

