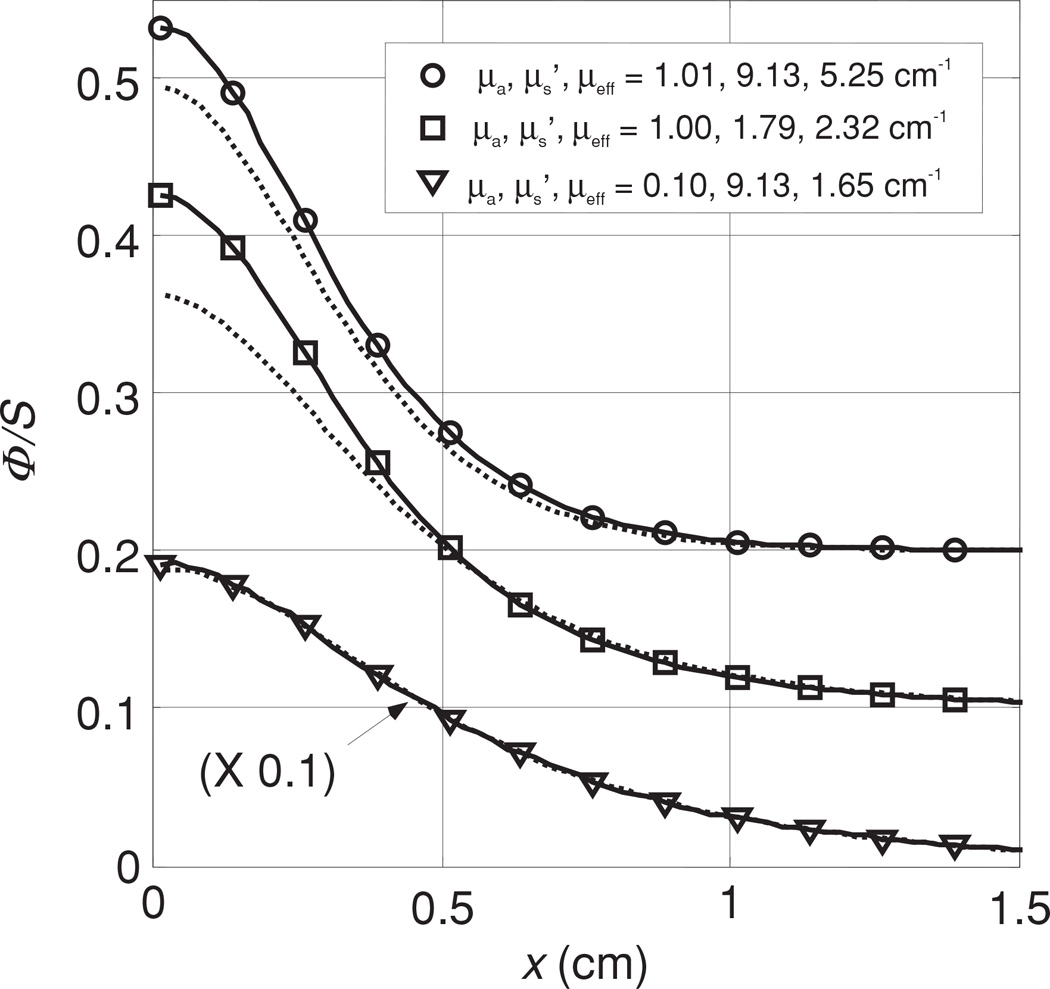
Figure 12.

Effect of the air gap introduced by the source catheter on fitting results. For each of three sets of optical properties (indicated in the legend), we plot the Monte Carlo simulated fluence rate measured by a detector at h = 5 mm from a source embedded in a 1.1 mm diameter catheter (solid line) and that in an infinite medium along a line separated by h = 5 mm from the source (dotted line).
