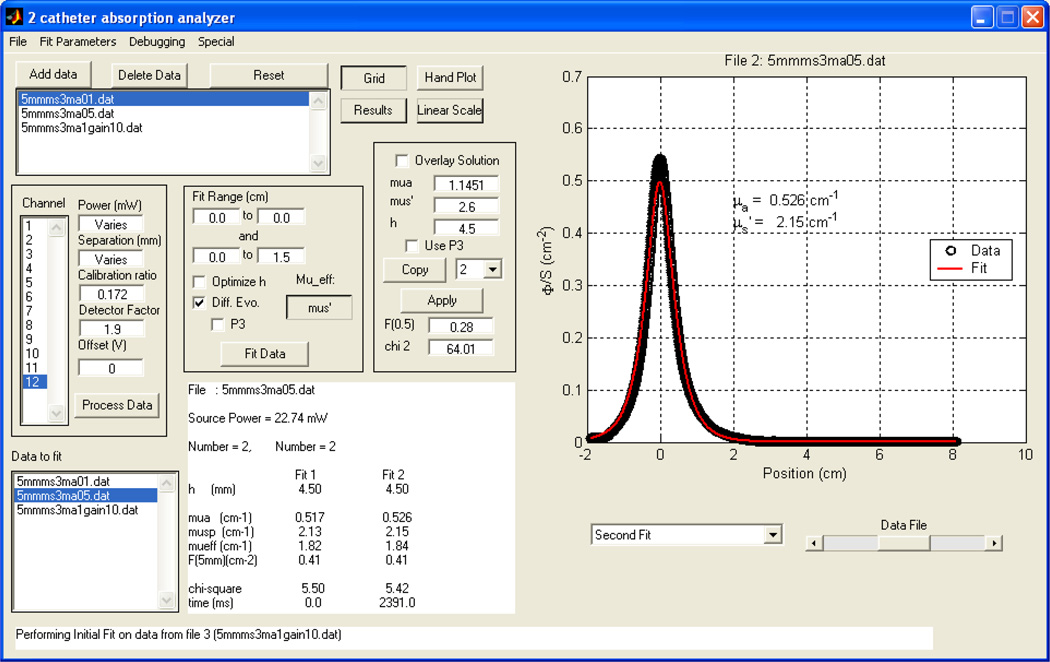
Figure 6.
The GUI of the fitting program for the determination of optical properties. The user can enter the power, the distance h calibration ratio, and the detector water correction factor, as well as the fitting range for x. One has the choice of (1) using a fixed h or (2) using the ‘optimize h’ for the program to find the optimal value of h. The overlay solution box lets one overlay a fit for a set absorption and scattering coefficient, using a constant h. Results summarized in the middle lower portion showing the current file name, source power (in mW), distance h between the catheters, values of absorption, scattering, effective coefficients, error and time for fitting (in ms). The program is available for download. (see text for details).

